Cloud bills are not self-explanatory. A monthly invoice from AWS, Azure, or GCP might contain thousands of line items across dozens of services, accounts, and regions, with no indication of which team generated the spend, whether it was expected, or what changed since last month. Cloud cost visibility tools exist to solve that problem: turning raw billing data into a structured, actionable view of where money is going and who is responsible for it.
This guide covers what cloud cost visibility actually means, what features matter when evaluating a platform, the business case for investing in it, and the ten tools most worth considering in 2026.
What Is Cloud Cost Visibility?
Cloud cost visibility is the ability to see, understand, and attribute cloud spend across your entire infrastructure in real time. It goes significantly beyond reviewing a billing dashboard. A team with genuine cost visibility can answer the following questions without manual investigation: which team or product owns this cost, what changed since last week, is this spend within expected range, and where is the largest optimization opportunity right now?
Cloud bills arrive with thousands of line items across multiple providers, services scale dynamically, and costs accumulate in real time across complex infrastructure. Without proper visibility tools, finance teams cannot allocate spending accurately, engineers cannot see the cost impact of their decisions, and leadership cannot understand what drives their cloud budget.
Effective cloud cost visibility has three layers. The first is data: normalized billing data from all cloud providers ingested into a consistent format, updated frequently enough to catch anomalies before they compound. The second is attribution: cost allocation that maps every resource to a team, product, environment, or cost center, so the data is actionable rather than just informative. The third is insight: anomaly detection, optimization recommendations, and reporting that surfaces the decisions and actions each stakeholder needs to take.
Key Features to Expect From a Cloud Cost Visibility Platform

Not all cloud cost visibility tools are built equally. When evaluating platforms, the following capabilities separate genuinely useful tools from dashboards that show you a bill in a slightly different format.
Multi-cloud coverage is the baseline for any organization running workloads across more than one provider. A tool that covers AWS but not Azure or GCP creates blind spots that undermine the entire visibility effort. The best platforms normalize data from all major providers into a consistent schema, so cost comparisons across providers are meaningful rather than approximate.
Cost allocation and tagging support determines whether the visibility is actionable or just informative. Platforms that support virtual tags, shared cost splitting, and allocation rules that can be applied without changing underlying resource tags are significantly more useful in environments where tagging compliance is incomplete.
Anomaly detection closes the gap between monthly reporting and operational management. A platform that detects unexpected cost movements in real time and routes alerts to the right team owner is qualitatively different from one that shows last month’s spend in a chart.
Granularity matters for engineering teams specifically. Service-level, resource-level, and environment-level cost breakdowns give engineers the specificity they need to identify what is driving a cost change and take action on it.
Reporting flexibility serves finance and leadership. Role-based views, scheduled reports, and the ability to slice spend by cost center, business unit, or product are what make a cloud cost visibility platform useful to non-technical stakeholders.
Infrastructure visualization is an underappreciated feature. Seeing resource relationships, attached and unattached assets, and what changed since the last sync in a visual format is often faster and more intuitive than querying billing data, particularly for waste identification and incident investigation.
The ROI of Cloud Cost Visibility tools
The business case for cloud cost visibility is straightforward. Global cloud spend is projected to exceed $700 billion, yet an estimated 20 to 35% of that spend is wasted on idle or oversized resources. For an organization spending $2 million per year on cloud, that is $400,000 to $700,000 in waste that is invisible without proper visibility tooling.
The ROI comes from three sources. Waste elimination is the most immediate: idle instances, unattached volumes, orphaned snapshots, and overprovisioned resources that can only be identified and acted on when they are visible. Commitment optimization is the second: Reserved Instances, Savings Plans, and Committed Use Discounts deliver 30 to 60% discounts on stable workloads, but purchasing them without visibility into actual usage patterns leads to overcommitment or undercommitment that reduces the savings. Accountability is the third: when engineering teams can see the cost of their infrastructure decisions in real time, they make different decisions. Unit economics that connect cloud spend to product outcomes are only possible when the underlying visibility is reliable.
Organizations that implement systematic cloud cost management consistently achieve 30 to 50% savings compared to unmanaged cloud spending, by continuously identifying and eliminating waste that manual processes miss between review cycles.
The Top 10 Cloud Cost Visibility Tools in 2026
1. Holori
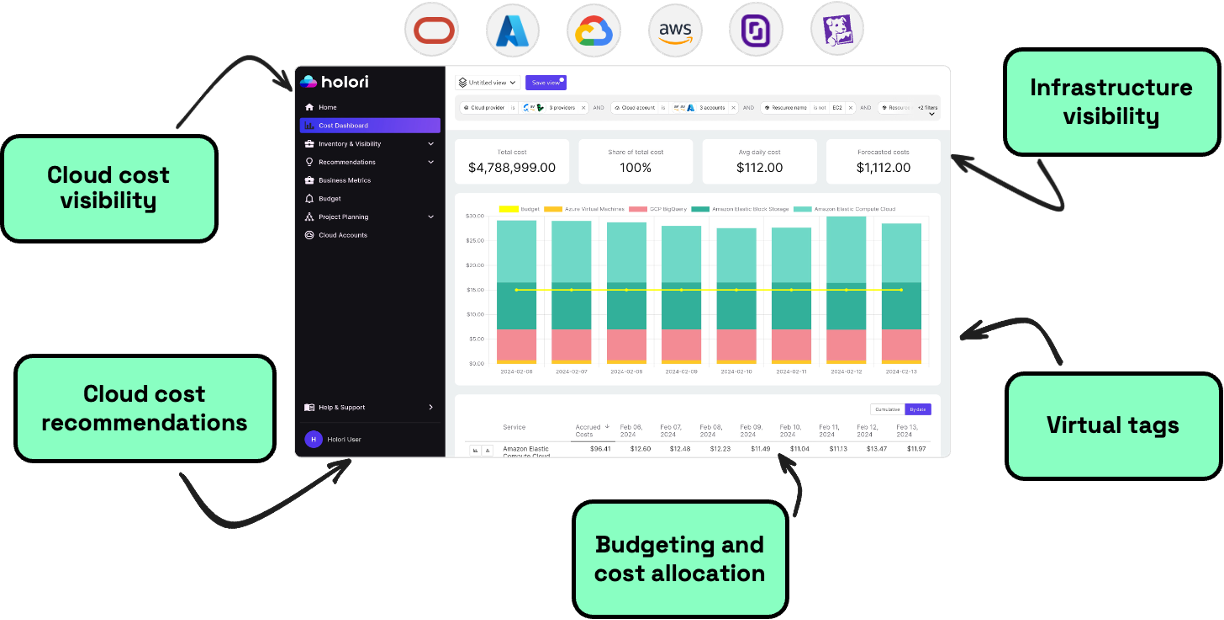
Holori is a multi-cloud FinOps platform built for teams managing costs across AWS, Azure, GCP, OCI, Scaleway, OVHcloud, and other providers. It provides two complementary visibility layers: a technical asset inventory that captures the full configuration of every resource, and a cost inventory that enriches each asset with spend data, tags, and virtual tags for complete attribution.
Virtual tagging allows cost allocation rules to be applied without modifying underlying infrastructure tags, which is critical in environments where tagging compliance is incomplete. Anomaly detection surfaces unexpected cost movements in real time across all connected providers.
Holori also generates daily infrastructure diagrams with a diff view that highlights new resources in green, deleted resources in red, and modified resources in yellow, giving platform and FinOps teams an immediate visual picture of what changed since the previous sync. Holori is particularly well suited for organizations that need unified multi-cloud visibility alongside infrastructure context, not just billing data.
Try Holori now for free: https://app.holori.com/
2. CloudZero
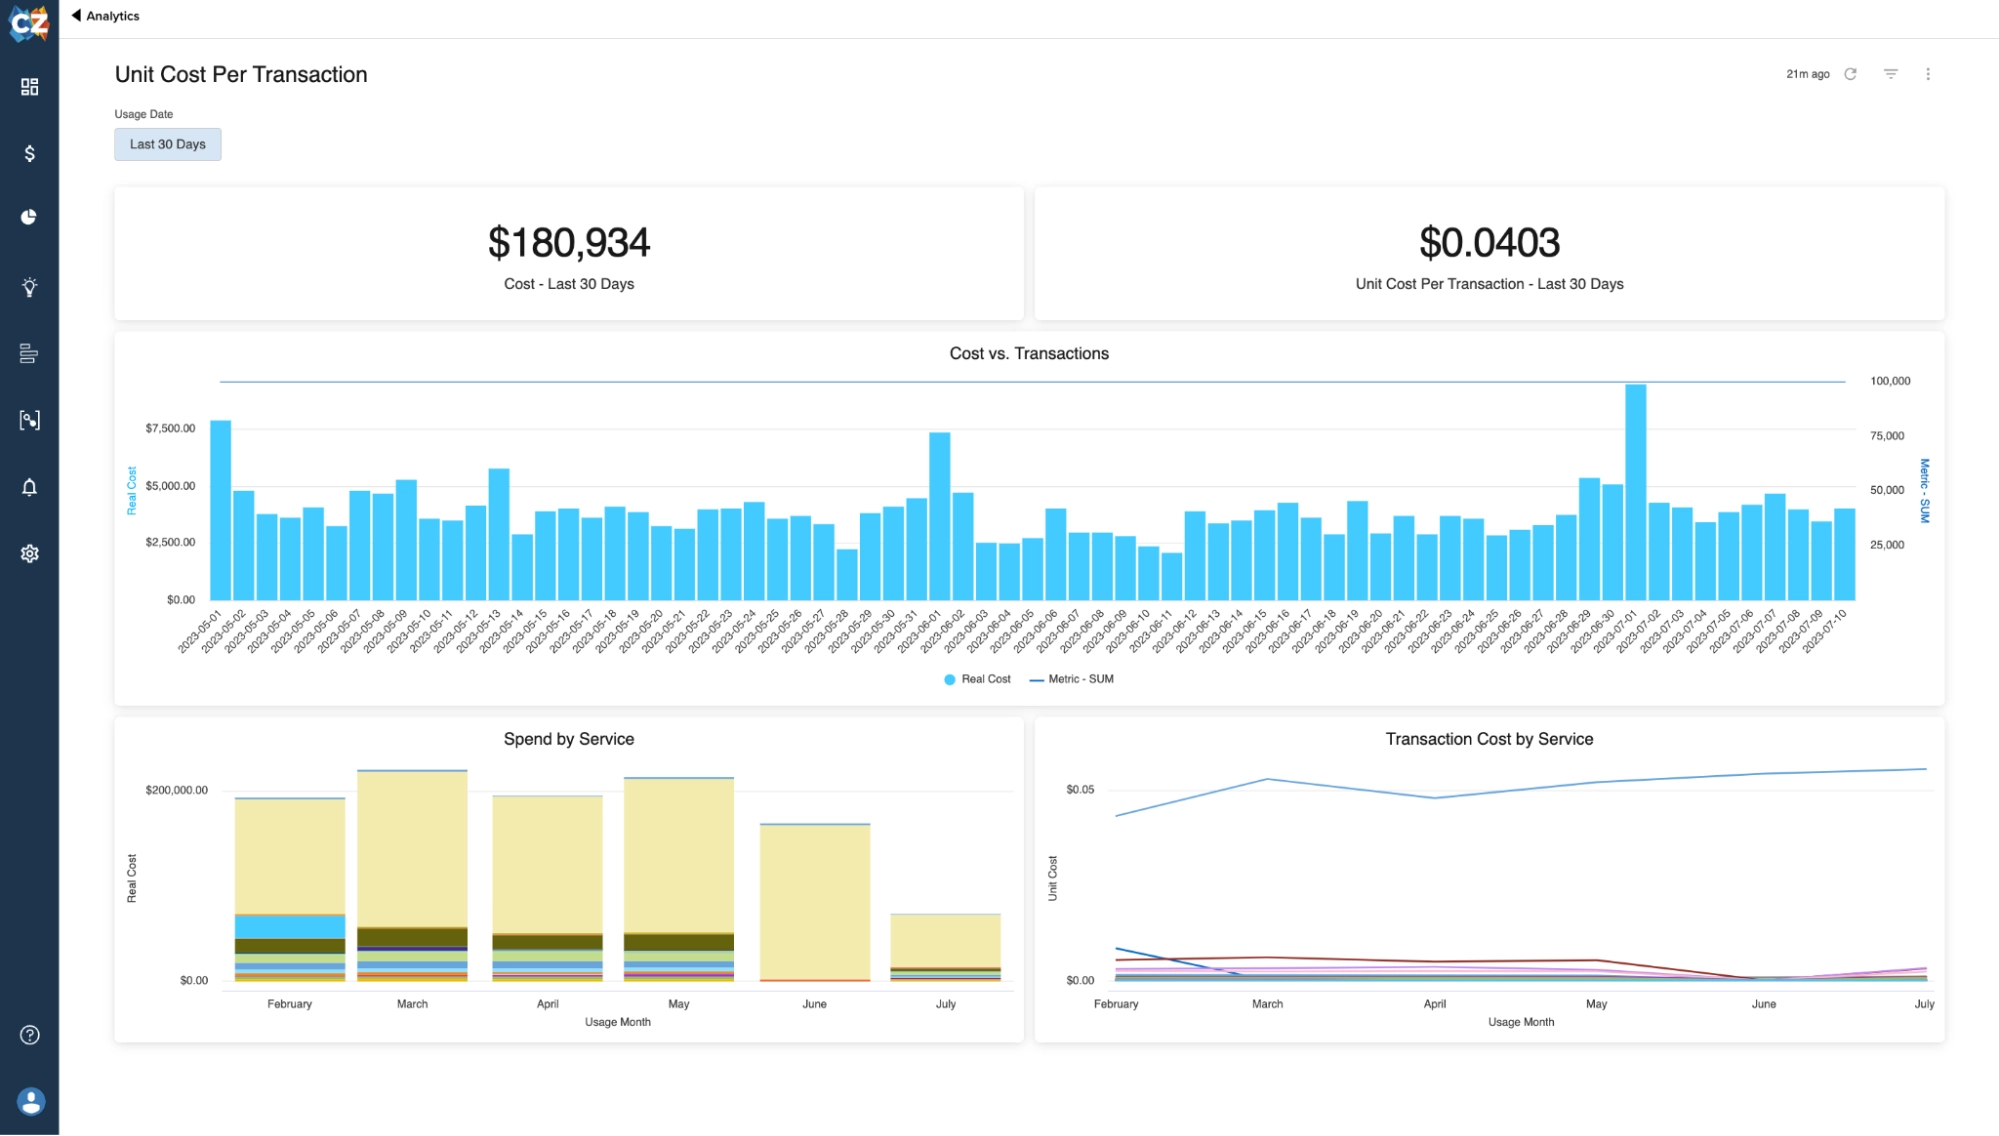
CloudZero is a cloud cost intelligence platform that connects cloud spend to business outcomes: products, features, customers, and engineering teams. Its strongest differentiation is the ability to allocate costs at the code level rather than just the resource level, which makes it particularly useful for SaaS companies that need to understand per-customer or per-feature cloud costs. CloudZero leads because its approach to cloud cost intelligence is materially different from the rest, connecting cloud spend to products, features, customers, or AI workloads in real time rather than just showing a bill in a different format.
3. Vantage
Vantage is a cloud cost visibility platform known for fast onboarding and a broad integration footprint. Vantage delivers comprehensive cloud cost visibility through more than 20 native integrations spanning AWS, Azure, Google Cloud, Kubernetes, and critical services like Snowflake, Datadog, OpenAI, and MongoDB, normalized into a single cost view. It is particularly well suited for mid-market teams that want broad coverage across cloud and SaaS spend in a single interface. Pricing is transparent and seat-based rather than percentage-of-spend, which makes costs predictable as cloud spend scales.
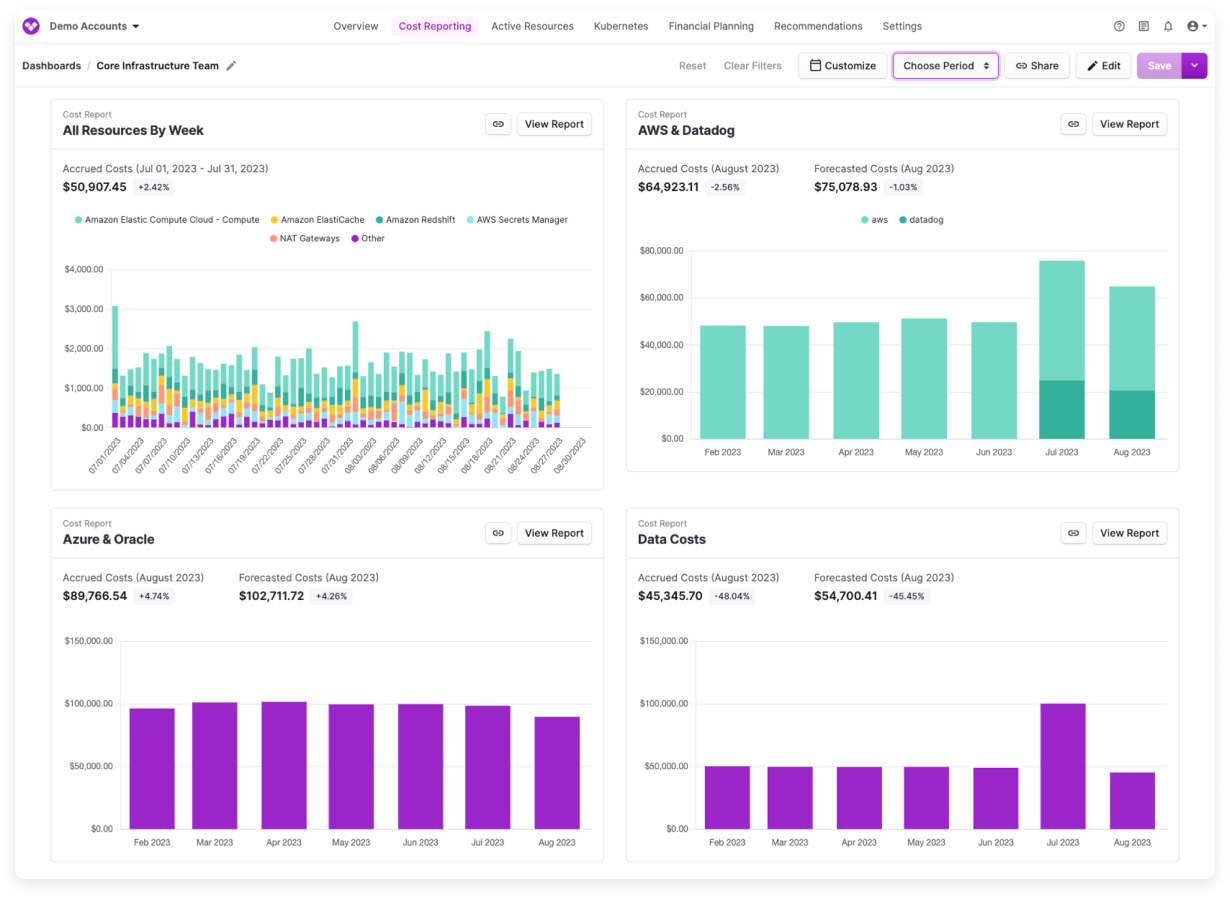
4. Apptio Cloudability
Apptio Cloudability is one of the most established enterprise FinOps platforms, well suited for large organizations with complex governance requirements, multi-cloud environments, and deep integration needs with existing financial systems. It provides strong showback and chargeback capabilities, long-term forecasting, and integration with ERP systems that finance teams rely on for budget management. The trade-off is implementation complexity and a user interface that reflects the platform’s maturity rather than modern design standards.
5. nOps
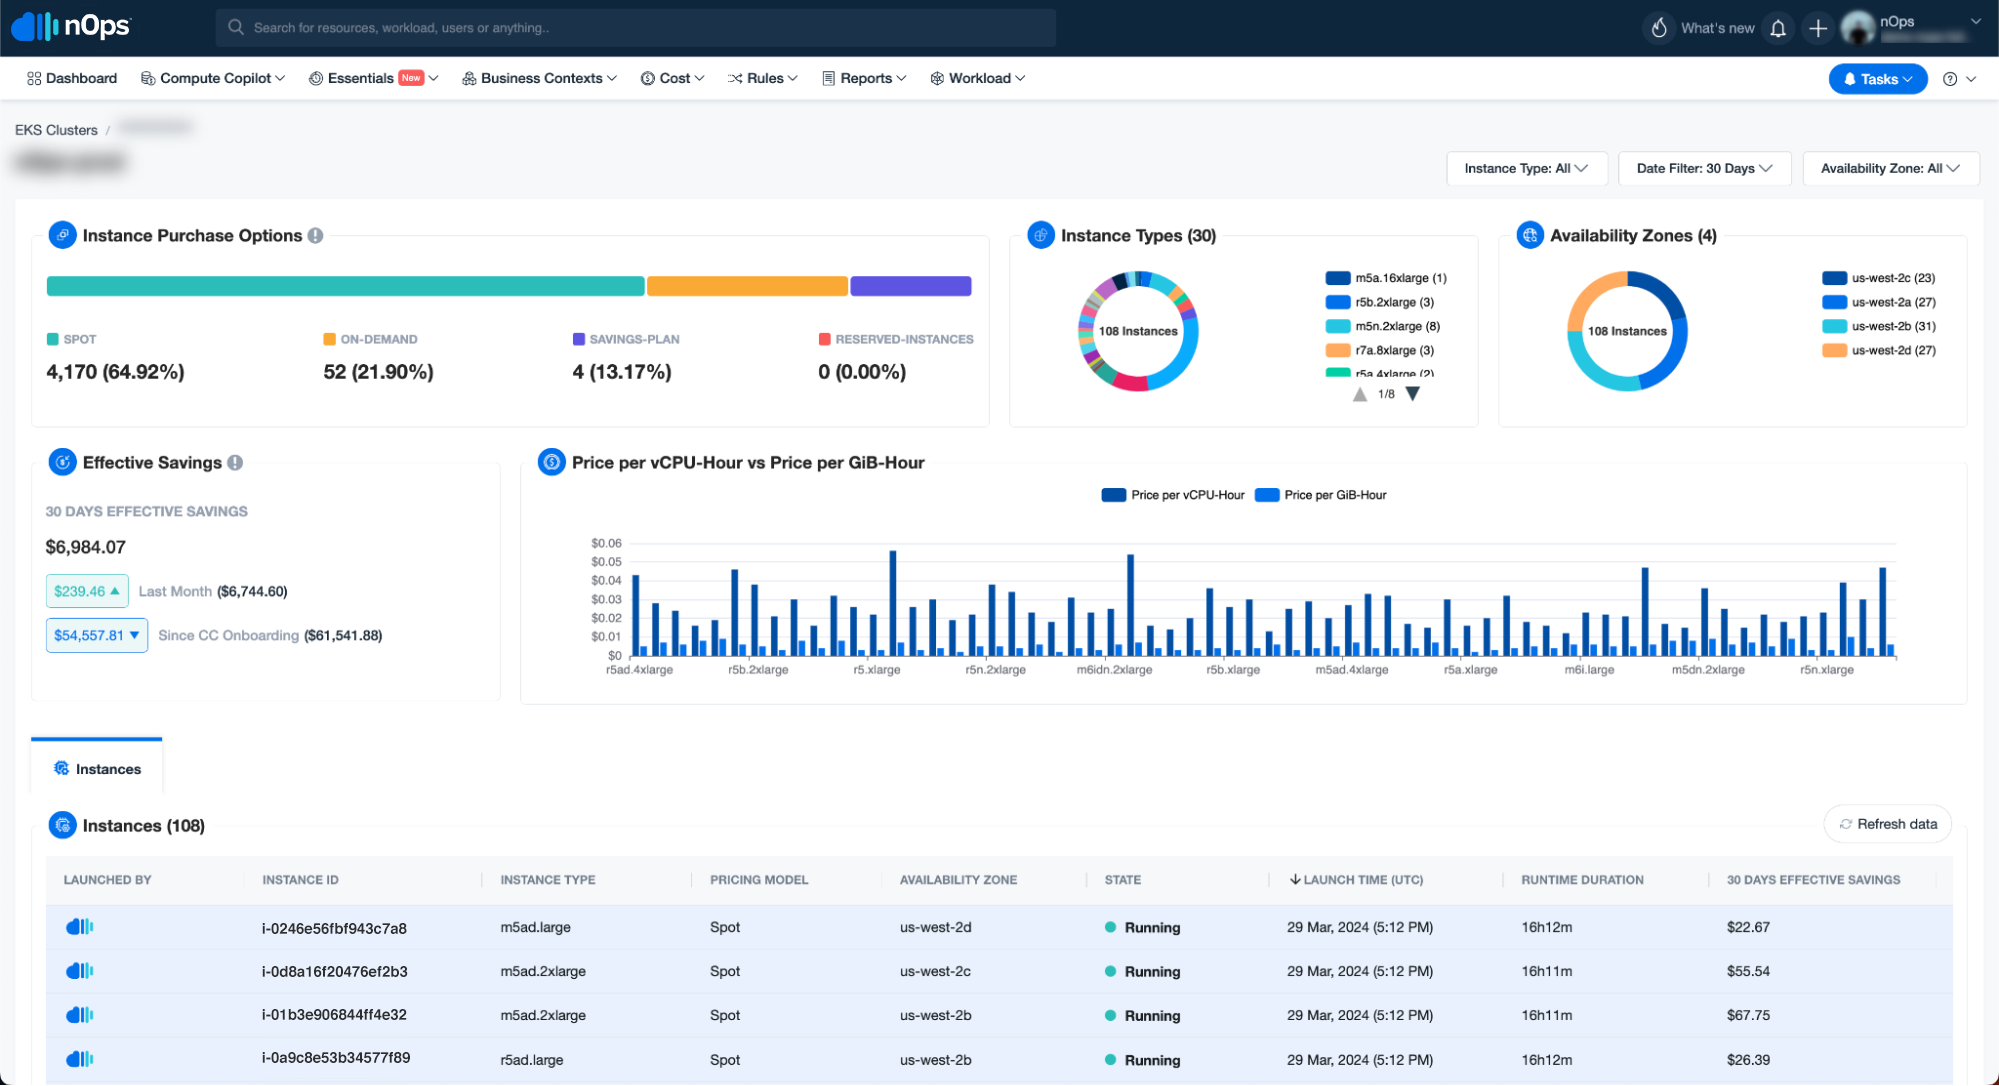
nOps combines cloud cost visibility with automated commitment optimization, focusing heavily on maximizing Effective Savings Rate across AWS, Azure, and GCP. Its AI-powered commitment management automatically adjusts coverage based on real-time usage patterns, which differentiates it from platforms that surface recommendations without automating execution. nOps delivers complete financial and operational visibility across AWS, Azure, GCP, Kubernetes, SaaS, and GenAI workloads within a single FinOps platform, designed to unify how finance and engineering teams see, manage, and optimize spend across the modern enterprise stack.
6. Finout
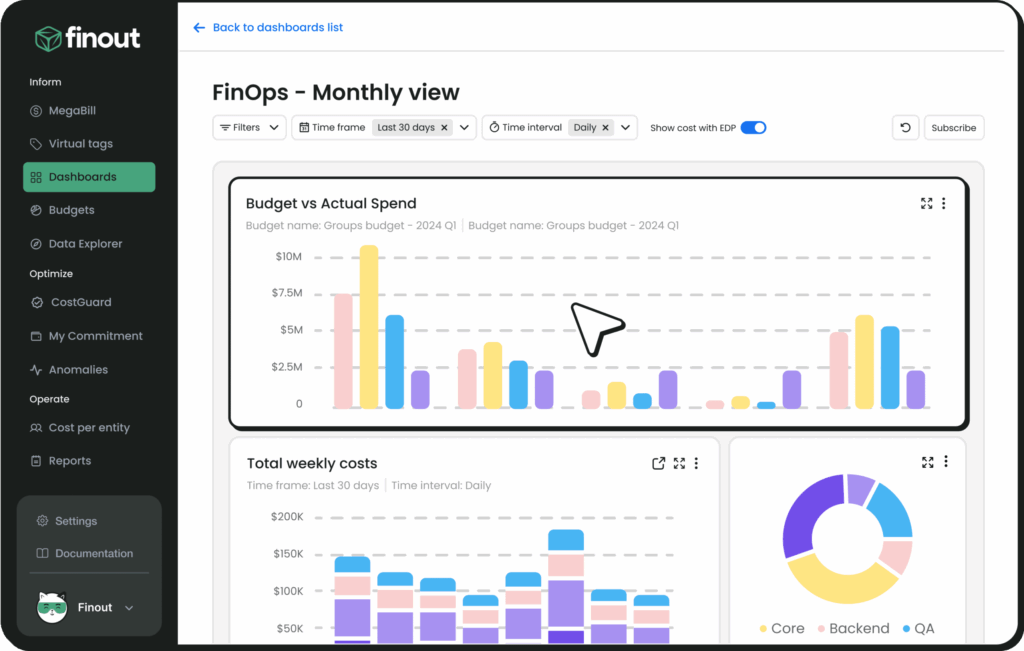
Finout focuses on cost allocation flexibility and is frequently cited for its virtual tagging capabilities and shared cost management. It supports a wide range of cloud providers and SaaS integrations, and its allocation model allows complex shared cost splitting rules that more rigid platforms cannot support. It is a strong fit for engineering-first organizations that need granular cost attribution across microservices architectures and want to avoid percentage-of-spend pricing models.
7. Harness Cloud Cost Management
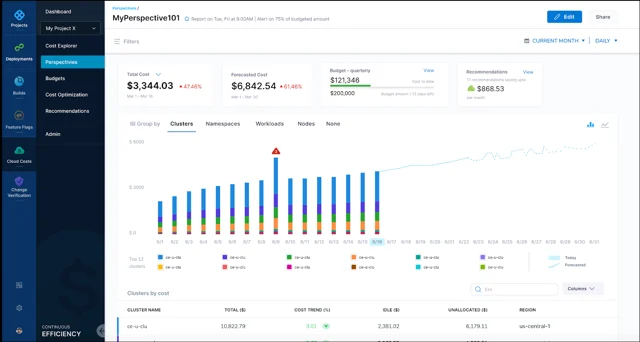
Harness Cloud Cost Management is built into the Harness DevOps platform, which makes it a natural fit for engineering teams already using Harness for CI/CD and feature management. Its AutoStopping feature detects idle environments using live traffic signals and stops them automatically, restarting on demand, which is genuinely unique in the market. The trade-off is that standalone cloud cost management outside of an existing Harness contract carries full platform pricing, making it more expensive than dedicated visibility tools at equivalent capability levels.
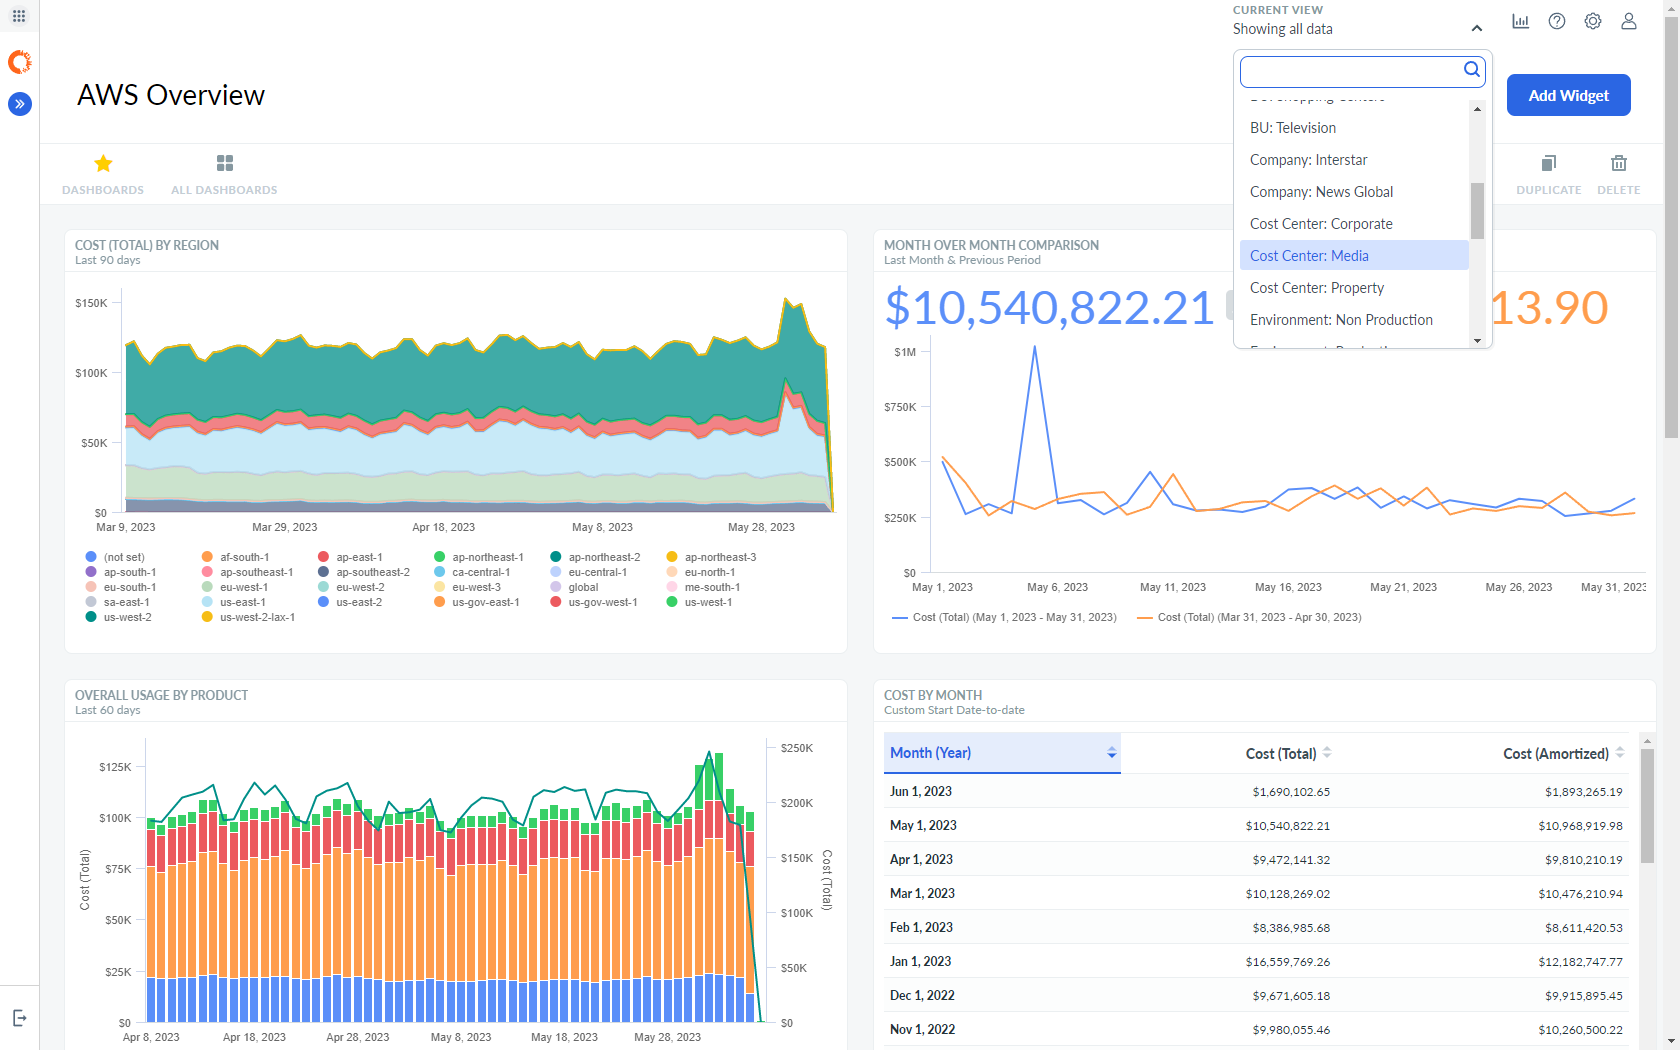
8. CloudHealth by VMware/Broadcom
CloudHealth is a comprehensive multi-cloud management platform with strong governance, policy management, and reporting capabilities. It is well suited for large enterprise organizations that need broad multi-cloud visibility alongside compliance and security governance in a single platform. CloudHealth provides enterprise governance but requires manual execution for optimization recommendations, leaving the gap between identifying savings and realizing them. Teams looking for automated remediation will need to supplement it with additional tooling.
9. AWS Cost Explorer
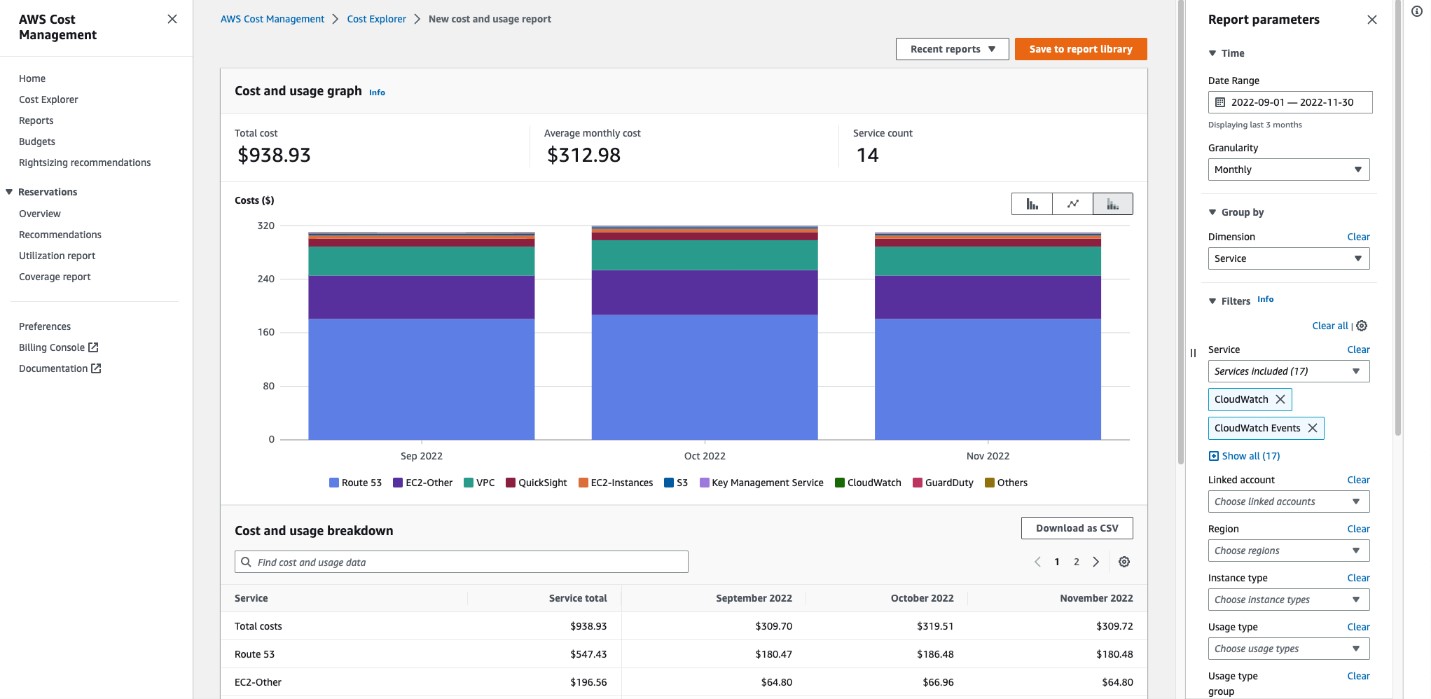
AWS Cost Explorer is the native AWS cost visibility tool included at no additional cost with every AWS account. It provides service-level cost breakdowns, filtering by account, region, and tag, Reserved Instance recommendations, and basic forecasting. It is the right starting point for teams running exclusively on AWS with straightforward cost management needs. Its limitations become apparent in multi-cloud environments (it covers only AWS), at scale (querying large datasets is slow), and for teams that need resource-level granularity or sophisticated allocation models.
10. Datadog Cloud Cost Management
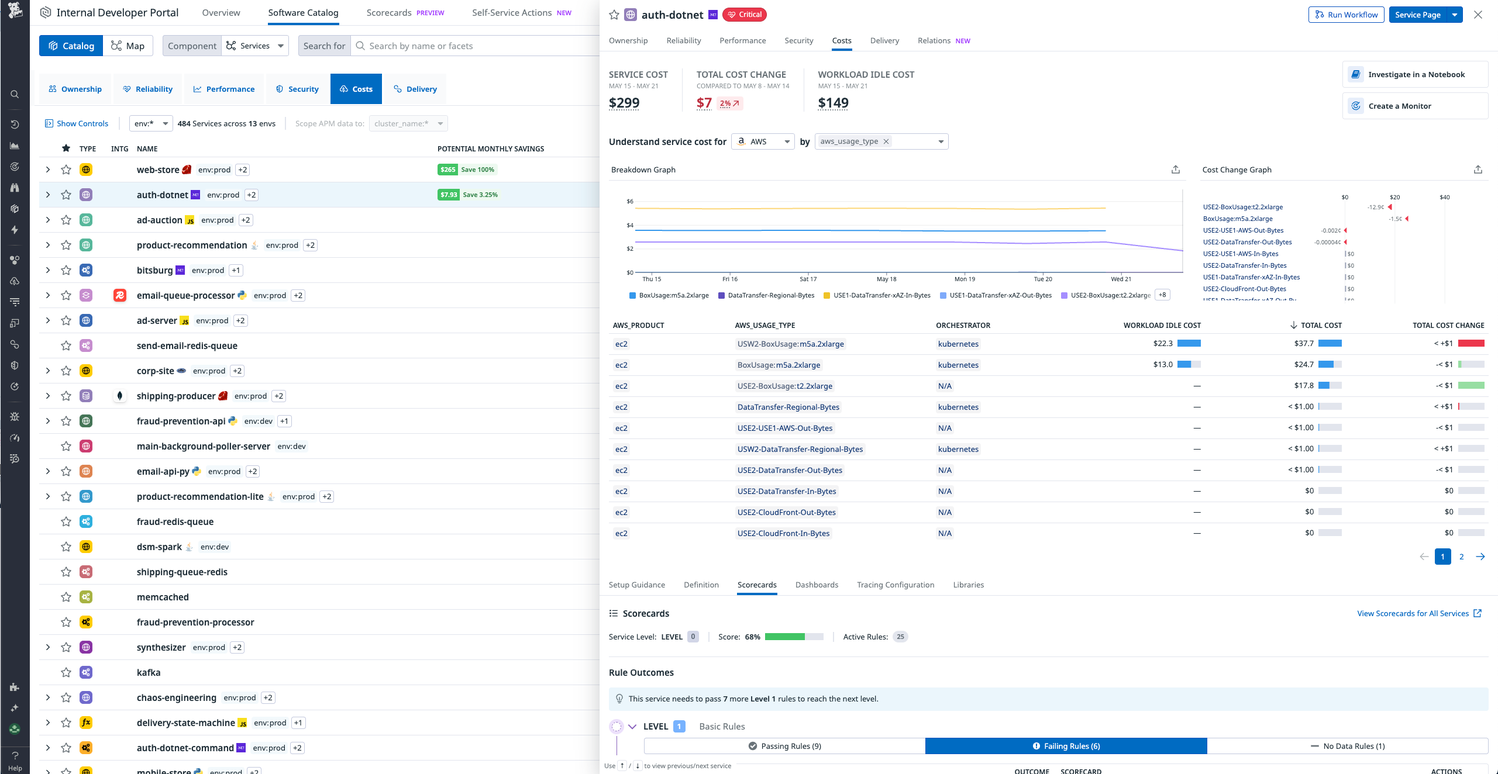
Datadog Cloud Cost Management integrates cloud billing data directly into the Datadog observability platform, which is its primary differentiator: teams can correlate cost changes with performance metrics and deployment events in the same interface they already use for monitoring. The cost visibility features remain secondary to core monitoring capabilities, with limited multi-dimensional analysis compared to purpose-built platforms, minimal native integrations beyond major clouds, and reporting flexibility that lacks the customization diverse stakeholders require. It is best suited for teams heavily invested in the Datadog ecosystem who want cost context alongside performance data rather than a dedicated FinOps workflow.
How to Choose the Right Cloud Cost Visibility Tool
The right platform depends on where your organization is in its FinOps maturity and what problem you are trying to solve first.
For teams in the early stages of cost management that need to establish baseline visibility and allocation quickly, a platform with fast onboarding, strong virtual tagging, and multi-cloud normalization is the priority. For engineering-first organizations that want cost data embedded in development workflows, a platform with granular resource-level visibility, anomaly alerting, and infrastructure context matters more than financial reporting depth. For enterprise organizations with complex governance requirements and finance team stakeholders, a platform with strong showback and chargeback capabilities, ERP integration, and budget management at scale is the right fit.
Regardless of which platform you choose, the prerequisite is the same: the tool is only as useful as the allocation accuracy underneath it. Before investing in advanced visibility features, ensure the platform can attribute at least 80 to 85% of spend to a specific owner. Without that foundation, the reports are informative but not actionable.