
When companies embark on their FinOps journey, one of the first questions that arises is: what tools should we use to manage and optimize cloud costs?
For many organizations already invested in Microsoft’s ecosystem, Power BI quickly emerges as an attractive option. It’s powerful, versatile, and already familiar to finance and analytics teams.
But how well does Power BI for FinOps actually perform? Can it really replace specialized FinOps platforms? And what are its limitations, especially compared to third-party tools like Holori?
This article dives deep into these questions, exploring both the benefits and drawbacks of using Power BI for FinOps — with a focus on hidden maintenance costs, data refresh challenges, and the fact that Power BI remains a reporting tool, not a system of action.
Why Power BI Attracts FinOps Teams
Power BI has clear advantages for organizations at the early stages of their FinOps practice:
Familiarity: Many finance and analytics teams already use Power BI for reporting and visualization.
Flexibility: It can ingest data from multiple sources, allowing teams to build custom dashboards.
Cost-effective at first glance: Since Power BI may already be licensed within the organization, there’s no immediate additional software purchase.
For companies just beginning to centralize cloud cost reporting, these points make Power BI appealing.
However, as FinOps practices mature, its limitations become more and more visible.
Power BI Integrations for Cloud Cost Data
One of the biggest questions around Power BI for FinOps is: can it connect directly to cloud billing data?
Here’s the reality:
Azure: Among the three major providers, Azure has the most “native” path. Power BI offers a dedicated Azure Cost Management connector, backed by Microsoft APIs and supported by an official Power BI template app for Azure cost analysis. However, this integration is limited to certain billing account types (like MCA or Enterprise Agreement) and doesn’t always expose full granularity for features like Savings Plans or Reserved Instances.
GCP: Power BI includes a native connector for BigQuery, making it relatively straightforward to analyze Google Cloud billing data — as long as that data is first exported to BigQuery. Some SQL transformation is usually needed to flatten or summarize the billing export, but the setup is stable and effective once configured.
AWS: AWS provides extremely granular cost and usage data through the Cost and Usage Report (CUR), typically stored in S3 as CSV or Parquet files. However, Power BI cannot connect to these files directly. To use them, teams must build a data pipeline (often via Athena, Redshift, or Glue) and then connect Power BI through a gateway. There’s no official one-click connector for AWS billing data, which means ongoing configuration and maintenance are required.
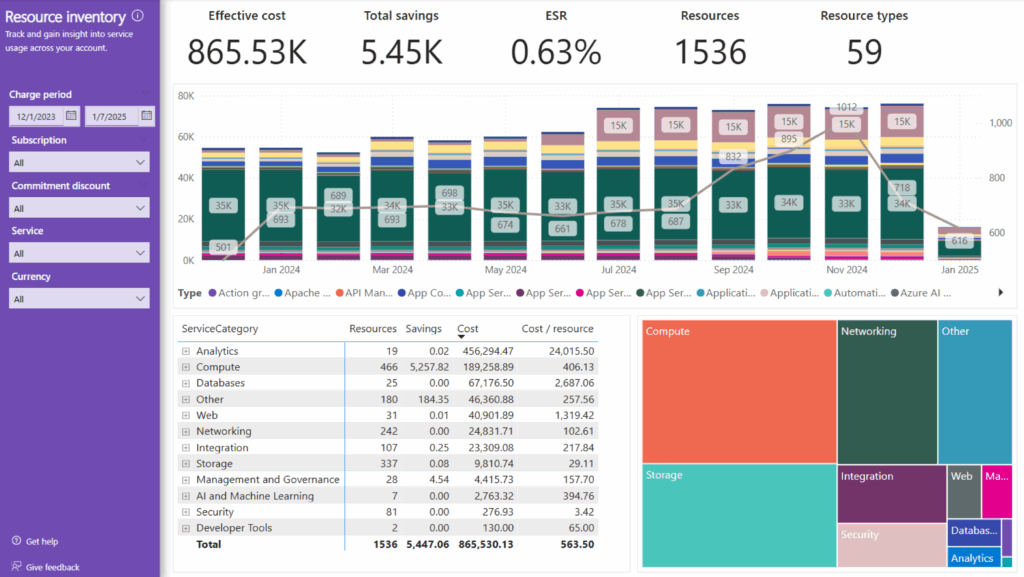
Even when Power BI successfully connects to your cloud billing sources, the data you get is raw and unmodeled. You don’t get ready-made FinOps metrics like “cost per business unit,” “unallocated spend,” or “savings plan utilization.” Instead, you have to design all of that manually — building data models, defining allocation rules, writing DAX measures, and maintaining complex relationships between tables. In contrast, specialized FinOps tools like Holori automatically structure this data, apply tagging logic, and generate actionable insights out of the box — saving weeks or even months of manual work.
In short, while Power BI can ingest cloud cost data, doing so is rarely straightforward.
Each integration involves setup, maintenance, and sometimes engineering resources to keep data accurate and up to date.
The Limitations of Power BI for FinOps
Despite its strengths, Power BI struggles to meet the advanced needs of FinOps teams. Let’s explore the key limitations.
1. Cost of development & maintenance
While Power BI itself may be inexpensive, the time and resources required to maintain it for FinOps are not.
Cloud billing datasets — especially AWS CUR — are large, complex, and constantly evolving. To keep dashboards accurate, teams often need engineers or analysts to:
- Build and maintain ETL pipelines.
- Handle schema changes when cloud providers update billing exports.
- Optimize queries and aggregations to avoid slow reports.
Over time, these hidden costs can easily outweigh the initial savings.
For example, imagine a company assigning two data engineers to develop & maintain a Power BI–based FinOps setup.
If each engineer costs around €80,000 per year, that’s €160,000 annually — just to keep the data pipelines running and delivering new insights.
By contrast, a ready-to-use FinOps platform like Holori might cost a fraction of that, while providing automated data ingestion, cost allocation, and optimization recommendations out of the box.
In other words: building your own FinOps reporting in Power BI is not free — it’s just shifting the cost from software to headcount.
2. Data Refresh and Latency
Power BI dashboards are not designed for large-scale or automated cloud cost ingestion.
Cloud billing datasets — particularly from AWS or Azure — can easily exceed Power BI’s dataset size and refresh limits, leading to:
- Failed or partial refreshes when datasets are too large.
- Manual workarounds such as aggregating or splitting data to stay within limits.
- Long refresh times, especially when connecting via gateways or DirectQuery.
While FinOps doesn’t require real-time data, it does rely on reliable and consistent daily updates.
Most cloud providers update billing data every 12–24 hours, and specialized FinOps platforms automatically handle these updates without manual intervention or pipeline maintenance.
With Power BI, however, refresh failures and manual aggregation often mean your dashboards fall days behind, creating delays in detecting anomalies or tracking cost trends.
3. Limited Granularity and History
Power BI’s performance constraints often force teams to choose between:
- Keeping only aggregated data for faster dashboards, or
- Working with painfully slow reports that include full detailed billing data.
This tradeoff means you may lose visibility at the service, account, or tag level — or be unable to retain historical data over long periods.
For example, analyzing a full year of detailed AWS CUR data in Power BI is often unmanageable without heavy optimization or data reduction.
4. It Remains Only a Dashboard — Not an Action Platform
Perhaps the most important limitation: Power BI is a reporting tool, not an operational one.
While it can visualize cloud spend, identify cost spikes, or even use built-in anomaly detection on time-series data, these features remain surface-level compared to what FinOps teams actually need.
Power BI does include an anomaly detection feature that can flag unusual data points in line-chart visuals. However, it’s limited to simple time-series datasets and does not support multi-dimensional or large-scale anomaly detection across accounts, services, or tags. More importantly, it doesn’t trigger alerts, ticket creation, or automated actions when anomalies occur. It’s a helpful visual aid — but not an operational monitoring system.
In practice, this means Power BI can show that an unexpected cost spike occurred, but it cannot help you investigate or respond to it. FinOps teams often need far more advanced workflows, such as:
- Automatically detecting cost anomalies across multiple clouds and accounts.
- Generating alerts or tickets when thresholds are exceeded.
- Applying virtual tags to untagged resources for consistent cost allocation.
- Defining and enforcing cost allocation strategies across teams or business units.
- Suggesting or applying optimization actions — such as rightsizing, commitment purchases, or stopping idle resources.
Power BI can display these insights if you build the logic elsewhere, but it cannot execute or automate them.
As a result, it remains reactive rather than proactive: it tells you what happened, but doesn’t help you change what will happen. help you change what will happen.
Why Third-Party FinOps Tools Are More Effective
Specialized FinOps platforms like Holori are built to go beyond dashboards. Here’s how they compare:
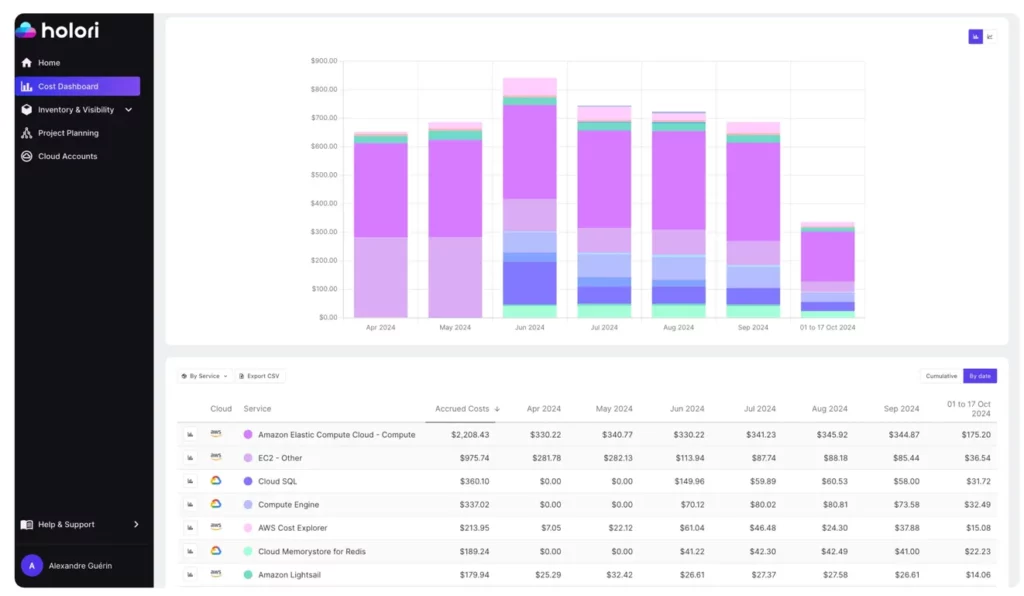
- Direct integrations: Holori connects natively to AWS, Azure, and GCP billing exports, with less manual setup than Power BI.
- Cost allocation and tagging: Virtual tags and multi-cloud views simplify cost breakdowns by team, project, or environment.
- Optimization features: Instead of just showing data, Holori highlights savings opportunities (e.g., rightsizing, Reserved Instances, Savings Plans).
- Automation: Some actions can be guided or automated, reducing manual intervention.
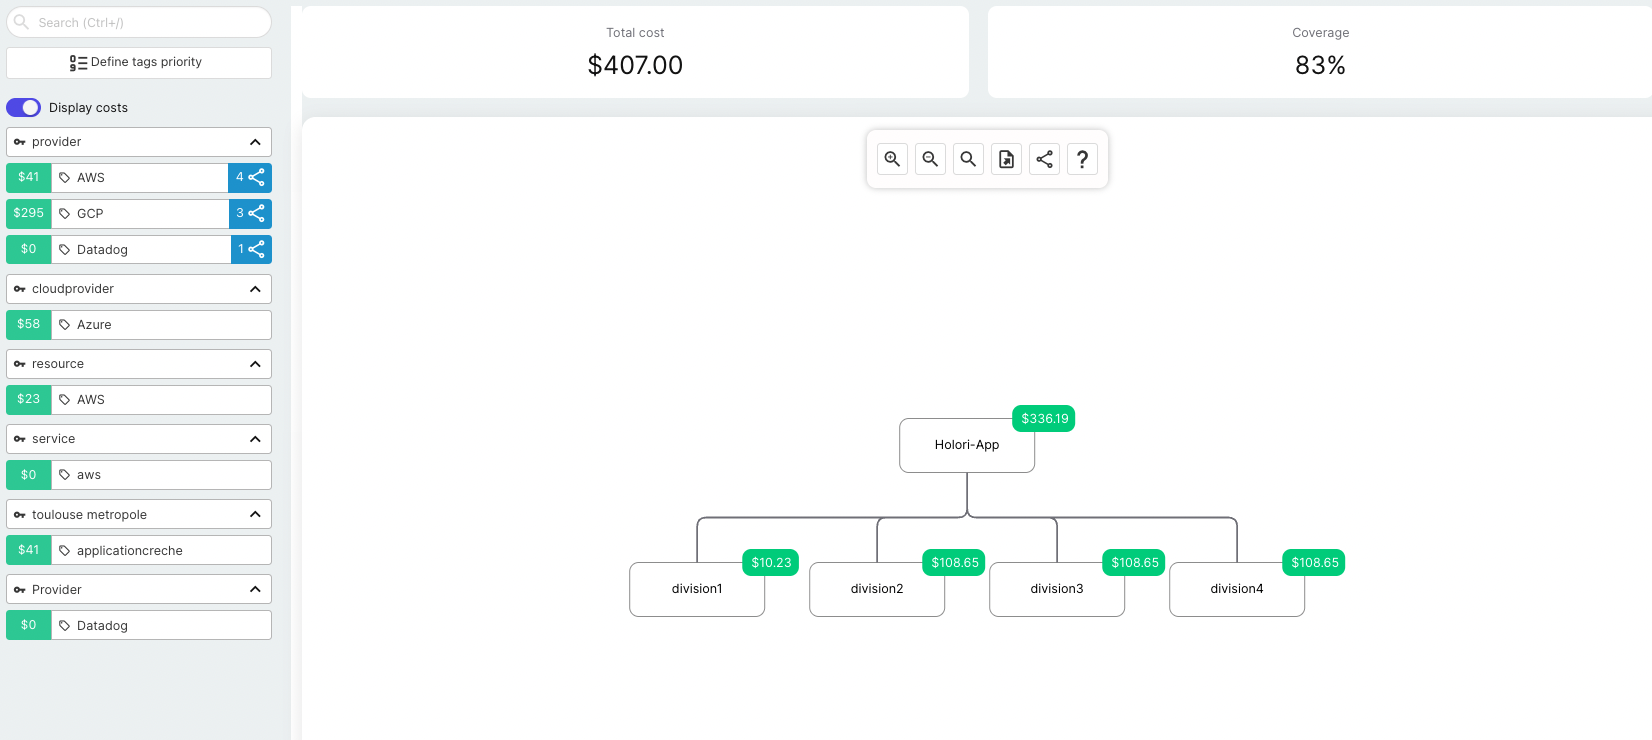
- Visual infrastructure mapping: With Holori Auto-Sync, you don’t just see costs — you see how your architecture drives those costs.
In short: Power BI tells you what is happening. Holori helps you understand why it’s happening and what to do about it.
When to Use Power BI vs. a Third-Party Tool for FinOps
Use Power BI if:
- You’re just starting your FinOps journey and need basic visibility.
- Your cloud environment is small and data volumes are manageable.
- You already have strong internal BI resources and want to experiment before investing in specialized tools.
Use a Third-Party Tool if:
- You manage multi-cloud or large-scale environments.
- You need daily or near real-time visibility into cost and usage.
- You want actionable insights, not just dashboards.
- You want to reduce the engineering burden of maintaining Power BI pipelines.
Conclusion – Is PowerBI for FinOps the best fit?
Power BI for FinOps can work as a starting point — it’s accessible, flexible, and cost-effective in the short term.
But as your FinOps practice matures, its hidden maintenance costs, refresh limitations, lack of granularity, and inability to take action quickly become major obstacles.
At its core, Power BI remains what it was built to be: a dashboarding tool.
And while dashboards are essential, FinOps success requires going beyond dashboards — into automation, optimization, and actionable insights.
This is why third-party FinOps platforms like Holori are increasingly the better choice for companies serious about managing and optimizing their cloud spend.