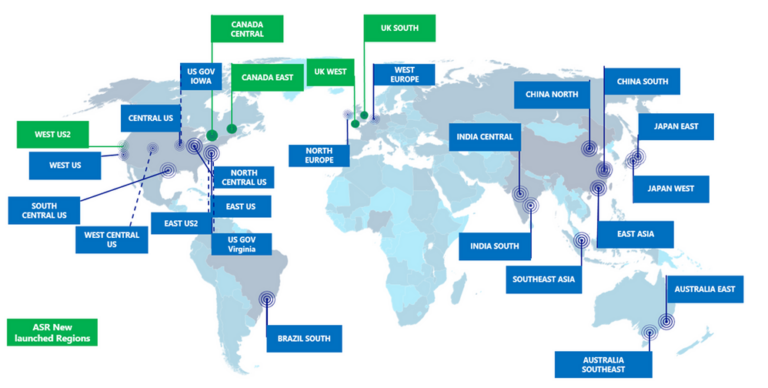
As of June 2024 there are more than active 40 Regions and more than 120 Availability Zones around the world. It’s similar to the size of the infrastructure available at AWS.
Table of Azure active regions
Here’s a comprehensive table of Azure regions, cities, and availability zones. This information is based on the latest data available from Microsoft Azure’s official documentation.
| Region | City | Availability Zones |
|---|---|---|
| East US | Virginia | 3 |
| East US 2 | Virginia | 3 |
| Central US | Iowa | 3 |
| North Central US | Illinois | 3 |
| South Central US | Texas | 3 |
| West US | California | 3 |
| West US 2 | Washington | 3 |
| West US 3 | Arizona | 3 |
| Canada Central | Toronto, Ontario | 3 |
| Canada East | Quebec City, Quebec | 3 |
| Brazil South | Sao Paulo State | 3 |
| Brazil Southeast | Rio de Janeiro | 3 |
| North Europe | Ireland | 3 |
| West Europe | Netherlands | 3 |
| France Central | Paris | 3 |
| France South | Marseille | 3 |
| UK South | London | 3 |
| UK West | Cardiff | 3 |
| Germany North | Berlin | 3 |
| Germany West Central | Frankfurt | 3 |
| Norway East | Oslo | 3 |
| Norway West | Stavanger | 3 |
| Switzerland North | Zurich | 3 |
| Switzerland West | Geneva | 3 |
| UAE North | Dubai | 3 |
| UAE Central | Abu Dhabi | 3 |
| South Africa North | Johannesburg | 3 |
| South Africa West | Cape Town | 3 |
| Australia East | New South Wales | 3 |
| Australia Southeast | Victoria | 3 |
| Australia Central | Canberra | 3 |
| Japan East | Tokyo | 3 |
| Japan West | Osaka | 3 |
| Korea Central | Seoul | 3 |
| Korea South | Busan | 3 |
| India Central | Pune | 3 |
| India South | Chennai | 3 |
| India West | Mumbai | 3 |
| China East | Shanghai | 3 |
| China North | Beijing | 3 |
Explanation of Azure Regions and Availability Zones

Azure Regions:
Think of them as separate geographical locations around the world, each containing multiple data centers.
Choosing the right region depends on factors like latency (speed of data transfer) and regulatory compliance needs.
Spreading your resources across different regions helps with disaster recovery, as an outage in one region won’t necessarily impact another.
Availability Zones:
Within a region, Azure offers availability zones. These are physically separate data centers connected by a high-speed network.
By deploying your resources across multiple availability zones within a region, you gain redundancy.
If one zone experiences an outage, your resources in another zone remain operational, minimizing downtime and ensuring business continuity.
In essence, regions provide broader geographic distribution, while availability zones offer redundancy within a specific region. This two-tiered approach lets you optimize your cloud infrastructure for performance, reliability, and disaster recovery.
Azure datacenter expansion plan
Microsoft, the company behind Azure, is aggressively expanding its data center footprint globally. This expansion aims to meet the ever-growing demand for cloud computing services. Recent reports suggest Microsoft is doubling its new data center capacity, securing significant additional server space worldwide. For example, a multi-billion dollar investment was announced for a new data center campus in the UK focused on AI, or a new datacenter in France for more than $4B showcasing their commitment to regional expansion. This strategy ensures Azure users benefit from lower latency (faster data transfer) and increased service availability across the globe.
Wrap Up: Optimizing Your Azure Footprint
Understanding Azure regions and availability zones empowers you to make informed decisions for your cloud environment. Factors like latency, egress costs, and regional pricing all play a role in selecting the optimal locations for your resources. For instance, deploying services in a region closer to your user base can minimize latency, while certain regions might offer more competitive pricing.
While Azure provides a default set of regions and virtual networks (VNets) with each account, navigating a complex cloud environment can be overwhelming. Managing numerous resources across diverse locations can lead to “shadow IT” or hidden costs associated with unused resources. Here’s where Holori comes in.
Holori acts as your cloud cartographer, automatically generating a visual representation of your entire Azure infrastructure. This includes pinpointing your resources across regions and availability zones, alongside valuable cost insights. By visualizing your Azure environment, Holori helps you identify underutilized resources (“zombie resources”) and optimize your overall cloud spend. Leverage Holori’s power to gain complete control over your Azure footprint and ensure cost-efficiency and optimal performance.
Try it out now: https://app.holori.com/


