Holori, the leading cloud infrastructure visibility platform, shatters multi-cloud complexity with a groundbreaking expansion. Businesses can now leverage Holori’s automated diagramming capabilities to gain instant clarity into their entire cloud environment, spanning across AWS, Azure, and GCP.
Automatic Insights at Your Fingertips
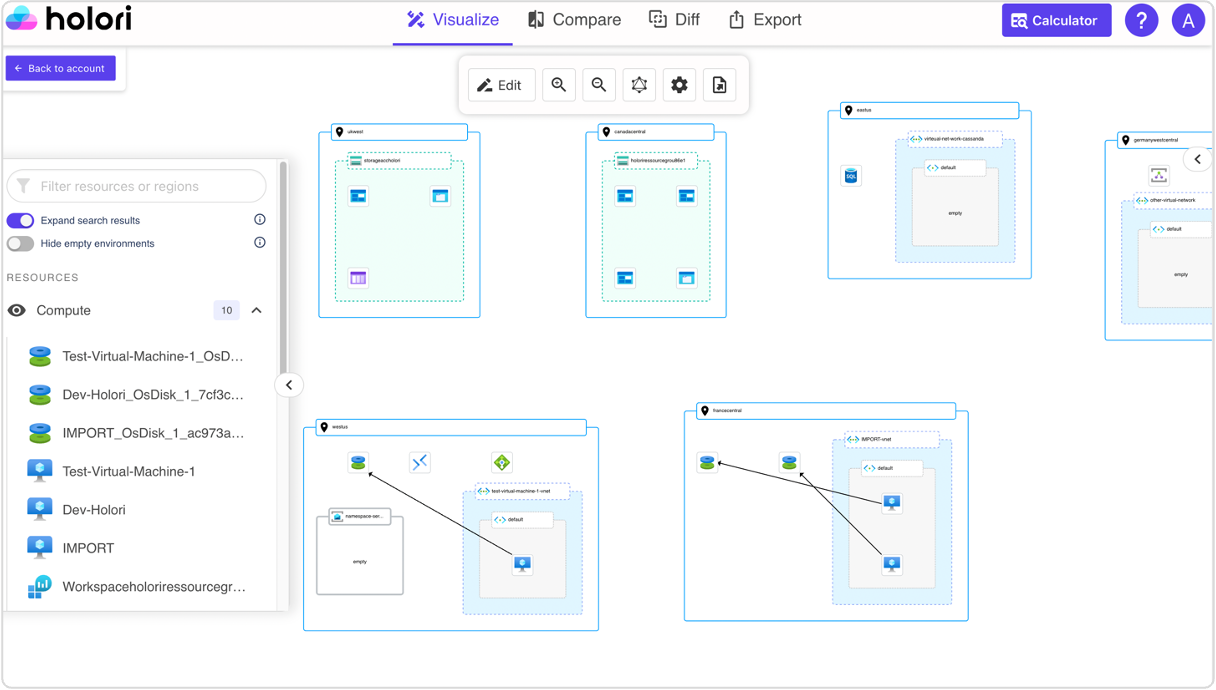
Say goodbye to the tedious task of manually mapping complex cloud environments using tools like Draw.io or clunky Excel spreadsheets. Holori eliminates this time-consuming burden by automatically generating comprehensive infrastructure diagrams for your existing infrastructure on any of the major cloud providers. This empowers you to:
- Visualize the Unseen: Gain instant understanding of your entire cloud ecosystem, including intricate dependencies and resource relationships, regardless of the cloud platform used. See how your resources interact and function as a whole, providing a clear picture of your cloud architecture.
- Effortless Asset Inventory: Holori automatically creates a detailed inventory of all your cloud assets across AWS, Azure, and GCP. This centralized view eliminates the need to hunt through different consoles, providing a single source of truth for your cloud resources and their configurations.
- Automated Documentation: Holori generates and maintains up-to-date documentation alongside your infrastructure diagrams. This ensures vital information about your cloud environment, such as security settings and access controls, is readily available at any time. No more scrambling to piece together documentation from disparate sources.
Efficiently Monitor Your Cloud: Never Miss a Beat
Modern cloud environments are in a state of constant flux, making it crucial to maintain up-to-date visibility. Holori addresses this challenge with its continuous monitoring capabilities. Schedule automated syncs – daily, weekly, or monthly – to ensure your infrastructure diagrams, asset inventory, and documentation are perpetually updated, reflecting any changes made to your cloud resources across AWS, Azure, and GCP. This continuous refresh unlocks the power of change tracking. Holori’s intuitive color-coded system makes it easy to identify modifications within your infrastructure over time. See resource additions, deletions, and modifications at a glance, allowing you to rewind and review the evolution of your cloud environment with ease. Imagine being able to pinpoint exactly when and how your cloud infrastructure changed, providing valuable insights for troubleshooting, security audits, and cost optimization.
Answering Critical Cloud Questions with Confidence
Holori empowers DevOps and IT teams to tackle critical cloud management challenges with newfound confidence:
- Cost Optimization: Visualize and monitor resources that are driving costs. Make sure resources are accurately configured. With Holori monitoring, understand how resources increase or decrease impact your cloud bill.
- Production Troubleshooting: Quickly pinpoint the root cause of production issues by analyzing historical changes across all your cloud platforms. Identify when and where changes were made that might have triggered the issue, leading to faster resolution times.
- Enhanced Collaboration: Foster seamless communication between teams with clear visual representations of infrastructure modifications across AWS, Azure, and GCP. A single source of truth for your cloud environment eliminates confusion and ensures everyone is on the same page.
- Security & Compliance Assurance: Maintain a comprehensive historical record of your cloud environment for simplified audits and compliance checks, regardless of the cloud platform used. Demonstrate a clear understanding of your cloud security posture for auditors and ensure ongoing compliance with relevant regulations.
Where Holori is heading next
Now that Holori is the best in class visibility platform that lets you visualize graphically your infra from AWS, GCP and Azure; it’s time to tackle the cost visibility part!
Since inception, Holori founders wanted to work on the cloud cost challenge as the costs at their prior startup skyrocketed. Similar to the diagramming software, the goal is to offer a self serve platform that is easy and intuitive to track your costs and optimize them.
Our motto is to bridge the gap between FinOps and DevOps through one collaborative platform that meet the needs of Finance and Engineering department. Indeed, DevOps enjoy working with a graphical interface whereas business people will better understand financial dashboard.
We will bring a cost overlay on top of the diagram to visualize the cost at the unit level. We will also enable virtual tagging of assets in the diagram to tag resources with drag & drop. Later on, the plan is also to display recommendations directly in the diagram. Moreover, the diagram from scratch feature (draw.io like) will be used for cost planification to accurately estimate project costs before deployment.
Concerning the Dashboard view, the goal is to create an easy multicloud cost management platform where any team within an organization can connect their accounts, visualize their costs and collaborate in minutes. Basically, Holori will offer a platform that offers a full FinOps workflow with visibility, tagging, notifications, budgeting and recommendations. Switching between the dashboard and the graphical view lets you drill down from a high-level cost overview to individual resources and their configurations.
We have made good progress on the dashboard for AWS and plan to release a first version very soon! Stay tuned!
In the meantime, visualize your Azure and GCP infrastructure for free : https://app.holori.com/

