Your team is still doing cloud cost management in a spreadsheet? You are not alone, and you are not wrong to have started there. When a company first launches some AWS instances or GCP services, exporting a billing CSV to Excel works. It is fast, familiar, and costs nothing. For a startup burning a few thousand dollars a month in cloud, it is often entirely sufficient.
But cloud environments do not stay small. They scale, they fragment across regions, accounts, services, and teams, they evolve daily. And somewhere between “good enough” and “no idea where money is going,” the spreadsheet quietly stops working. Not dramatically, but in subtle, compounding ways that erode cost visibility until the problem becomes undeniable.
This article breaks down exactly why spreadsheets fail at cloud cost management. Not as a dismissal of a useful tool, but as an honest technical and operational analysis of where they hit their limits. For FinOps practitioners, engineering leaders, and finance teams trying to mature their cloud financial management, understanding this failure mode is the first step toward fixing it.
The Attraction of the Spreadsheet in Early-Stage Cloud Management
Before diagnosing the failure, it is worth acknowledging why spreadsheets dominate early cloud cost workflows. Every cloud provider , big such as AWS, Azure, GCP, OCI, or small makes it easy to export a billing report. You open a CSV in Excel , filter by service or tag, and have an instant view of where money went. For many teams, this represents more cost awareness than they had before, and that is genuinely valuable.
Spreadsheets also have a seductive advantage: everyone knows how to use them. Finance teams are comfortable with Excel. Engineers use Google Sheets for runbooks. Product managers track budgets there. The barrier to getting a shared view of cloud costs is essentially zero. No procurement, no onboarding, no integration.
The problem is not the spreadsheet as a concept. The problem is the assumptions baked into spreadsheets. That data is static, the person entering it is also the person who understands it, updates are manual. And none of those assumptions hold in a modern cloud environment.
Problem 1: Cloud Billing Data Is Too Large and Too Dynamic for Manual Handling

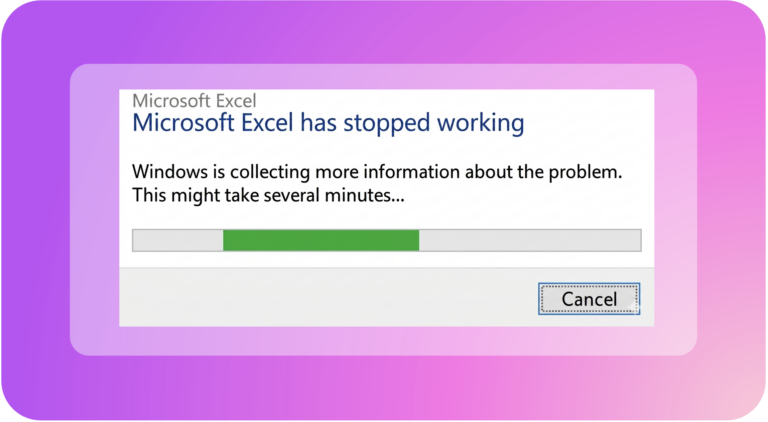
Modern cloud billing data is not a simple table. AWS Cost and Usage Reports (CUR) contain hundreds of columns. A mid-size company running workloads across multiple accounts, services, and regions can generate millions of billing line items per month. Let’s consider a “modest” multi-cloud environment; say AWS for core infrastructure, GCP for data workloads, and Azure for Microsoft integrations. It produces billing exports that routinely exceed what Excel can handle without performance degradation or outright crashing.
The raw CUR from AWS alone, at full granularity with resource-level data enabled generates files exceeding several gigabytes per month. Excel’s row limit of 1 million sounds generous until you realize that 1 day of usage data nears that ceiling. Moreover, Google Sheets fares even worse with large datasets.
Beyond size, cloud billing data changes continuously. Basically, spreadsheets are designed around the assumption that once a cell is written, it stays valid until someone changes it. Cloud billing inverts this: data is always provisional until the billing period closes. Even then, adjustments and credits can arrive weeks later.
The practical consequence is that FinOps teams relying on spreadsheets spend enormous amounts of time not analyzing cost data, but cleaning, reshaping, and re-importing it. According to the FinOps Foundation’s State of FinOps research, organizations that are scaling their cloud cost management through automation dramatically outperform those relying on manual processes. Not because they have larger teams, but because their tools work continuously rather than in monthly cycles.
Problem 2: Cost Allocation at Scale Is Structurally Incompatible with Spreadsheets
Cost allocation is the discipline of answering this question. Which team, product, or business unit is responsible for which cloud spend? In a well-tagged, single-cloud, single-account environment, this might seem tractable in a spreadsheet. In reality, it’ almost never it’s not.
The first problem is shared resources. Used by multiple teams simultaneously, their costs cannot be attributed to a single owner without applying allocation logic. That goes beyond what a VLOOKUP or pivot table can handle. You must define split ratios, apply them across billing periods, and recalculate them when ownership or workload distribution changes.
The second problem is tag inconsistency. In any real-world cloud environment, tagging is imperfect. Resources get launched without tags, tag values drift etc. Teams also use different naming conventions, and cloud providers have services that cannot be tagged at the resource level. Spreadsheet-based allocation workflows lead to a situation where the allocation model lives both in the spreadsheet and in someone’s head.
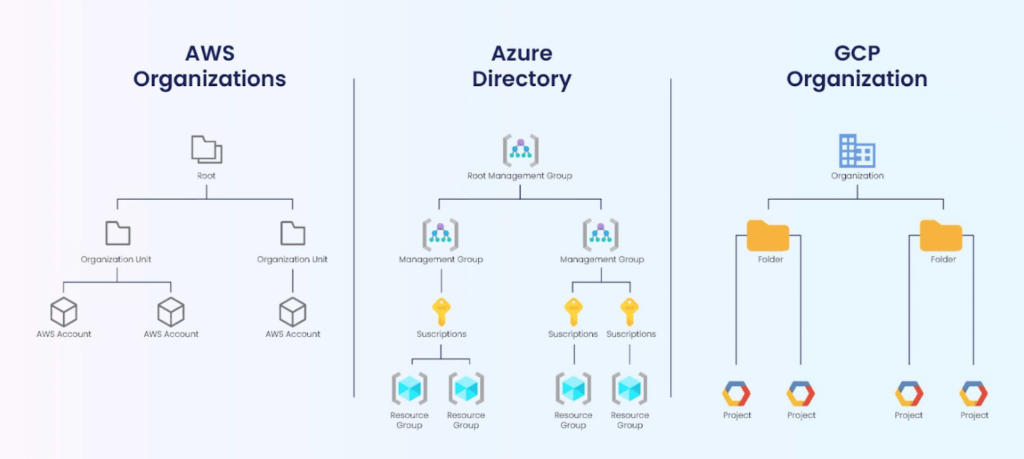
The third problem is multi-cloud. When you are allocating costs across AWS, Azure, and GCP simultaneously, you are dealing with fundamentally different environements. For example billing structures, cost dimensions, tag schemas, and different concepts of what a “project” or “account” or “subscription” means. Normalizing these into a coherent allocation model in a spreadsheet is clearly tedious but also hard to maintain. Every time any provider changes their billing format (and they do, regularly), the spreadsheet breaks.
Dedicated cloud cost management platforms address this by ingesting billing data from all providers through maintained connectors, applying consistent normalization, and enabling virtual tagging. Virtual tagging is the ability to define allocation rules that work even across untagged or inconsistently tagged resources. This is the kind of structural capability that cannot be retrofitted into a spreadsheet.
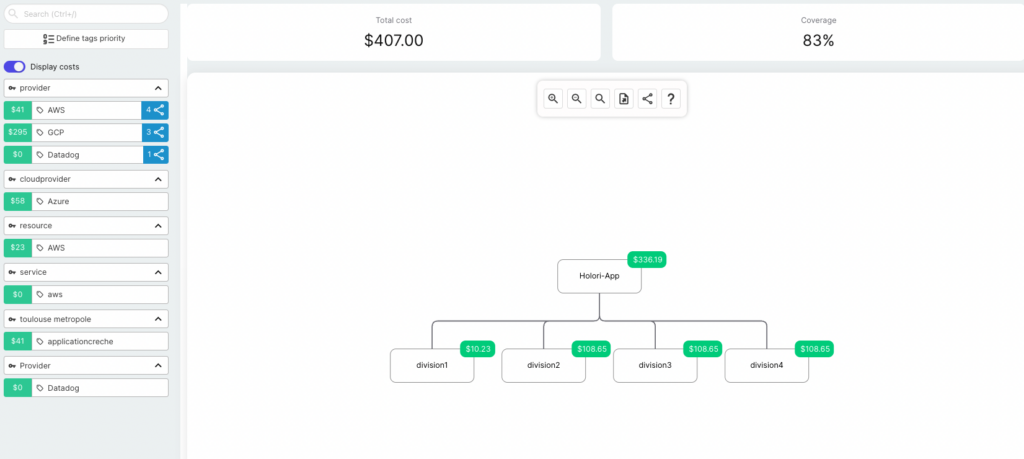
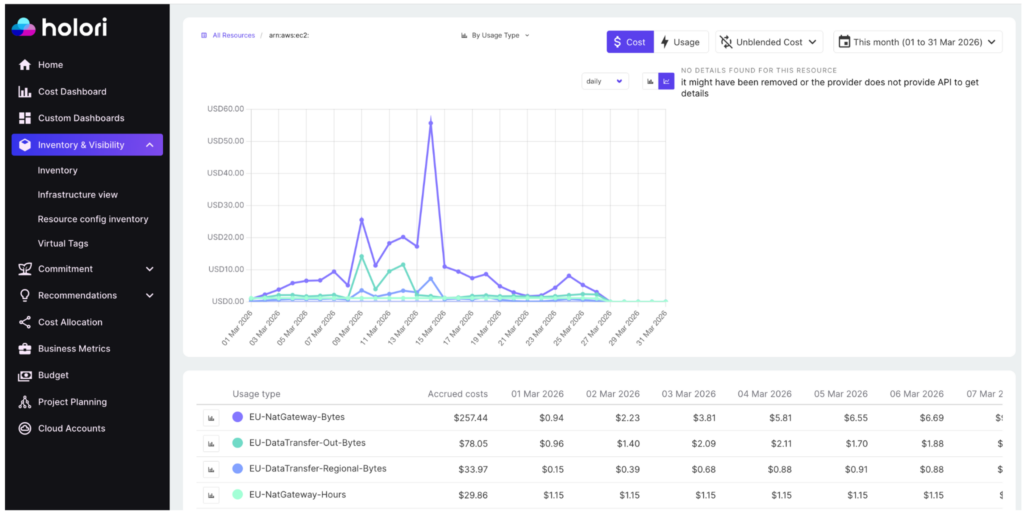
Holori visual cloud costs allocation
Problem 3: Spreadsheets Provide Retrospective Visibility, Not Real-Time Awareness
One of the most dangerous limitations of cloud cost management in a spreadsheet is its fundamental orientation toward the past. You export last month’s billing data, analyze it, and produce a report. By the time that report reaches stakeholders, the costs it describes are three to four weeks old. Any anomaly, unexpected spike, resource that was left running has been accumulating while you waited for the billing period end.
In a world where cloud spend can double overnight due to a single decision, waiting until month-end to discover the problem is not risk management. It is retroactive damage assessment.
Real-time and near-real-time cloud cost visibility requires continuous data ingestion from cloud provider APIs, alerting logic, and anomaly detection. None of these capabilities exist in a spreadsheet.
The operational implication is that teams using spreadsheets for cloud cost visibility are flying partially blind between billing periods. The best they can do is check their cloud provider’s native cost console.
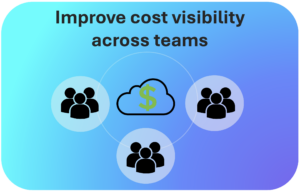
Problem 4: Collaboration and Accountability Break Down
Cloud cost management is not a solo activity. Engineers understand resources utilization, finance teams own budgets, product managers make trade-off decisions, and leadership requesting a global picture. Spreadsheets, despite being shareable, are structurally bad at enabling this kind of multi-stakeholder collaboration.
Beyond data integrity, spreadsheets offer no workflow. There is no way to:
- Assign a cost optimization action to an engineer and track whether they acted on it.
- Create a budget alert that sends Slack messages to the right team when their service exceeds their monthly allocation.
- Get an audit trail showing who approved a Reserved Instance purchase or why a budget exception was granted. The accountability layer required by mature FinOps simply does not exist in a spreadsheet model. Here we are talking about the closed loop between cost data, action, and outcome.
This is why the FinOps Foundation emphasizes that cloud financial management is an operating model, not just a reporting exercise. The tools that support it need to enable workflows, not just display numbers.
Problem 5: Forecasting and Budgeting Are Fundamentally Broken
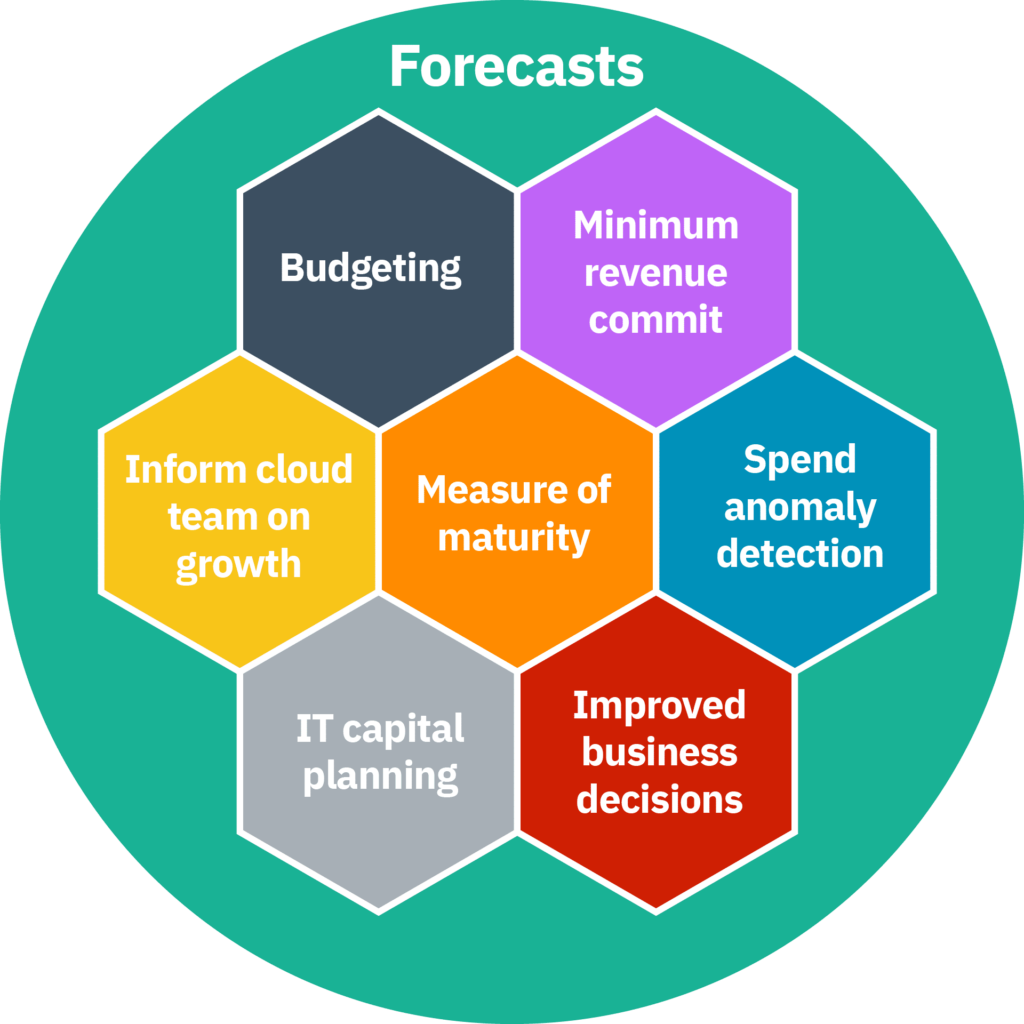
Cloud cost forecasting in a spreadsheet typically works something like the following. Take last month’s spend, apply a growth rate based on intuition or recent trends, add a buffer for uncertainty. This approach has the appeal of simplicity and the significant disadvantage of being almost always wrong in ways that matter.
Cloud spend is not linear. It’s driven by a combination of commitments (Reserved Instances, Savings Plans, CUD), variable workloads that scale with traffic or data volume, one-time events like migrations or new product launches, and engineering decisions that can have large, non-linear cost impacts. A growth-rate extrapolation in a spreadsheet captures none of this structure.
The deeper problem is that a spreadsheet-based forecast cannot incorporate forward-looking signals. It does not reflect the Reserved Instance coverage targets the FinOps team has set. It does not model the cost impact of a planned architecture change. Meaningful cloud cost forecasting requires integrating financial modeling with infrastructure planning. But, this means it needs to be connected to the systems where infrastructure decisions are made, not isolated in a static document.
The FinOps Foundation’s cloud forecasting guidance is explicit on this point: effective forecasting shifts ownership to engineering leaders and bases predictions on real-world future plans, not just historical trends. A spreadsheet physically cannot receive this input at scale. It requires someone to manually collect information from every team, translate it into cost estimates, and enter it into the model. A process that is both slow and unreliable…
Problem 6: Kubernetes and Modern Infrastructure Are Invisible in Spreadsheets
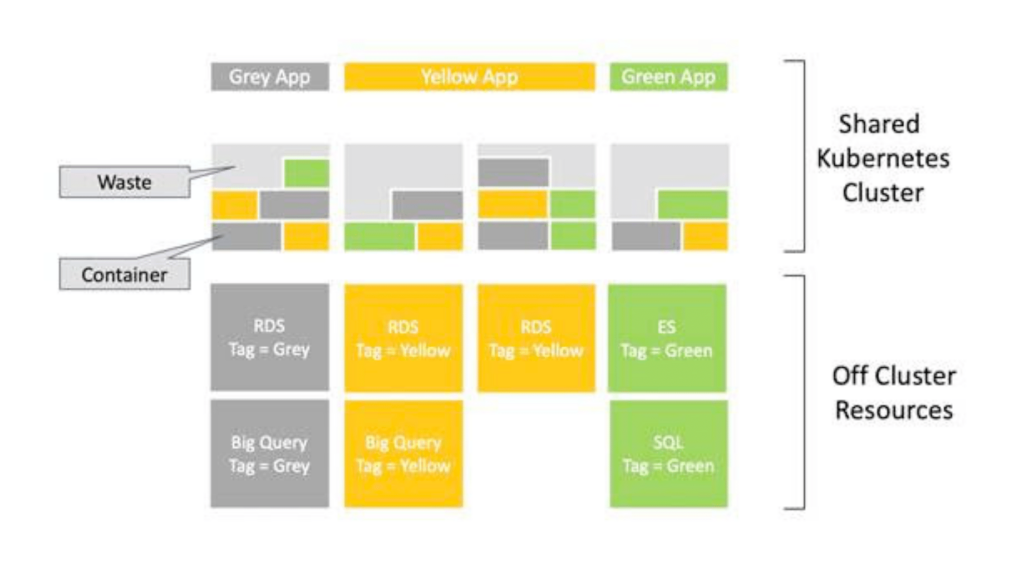
Even if spreadsheet-based cost management were adequate for traditional cloud resources it breaks when Kubernetes enters the picture. Kubernetes cost allocation is indeed one of the hardest problems in cloud financial management. It is a problem that cloud provider billing systems themselves do not fully solve.
When you run a Kubernetes cluster, the cluster appears as a line in your cloud bill. For example a set of EC2 instances, or node pools in GKE or AKS, with an associated cost. But which namespace, which deployment, which team, which microservice is responsible for which fraction of that cost? The billing data does not answer this question. The answer requires correlating pod-level resource requests and actual consumption data from the cluster with the underlying node costs. This computation hat requires active instrumentation of the cluster, not a CSV export.
Spreadsheets cannot query the Kubernetes API, and cannot dynamically allocate node costs across workloads based on actual CPU and memory consumption profiles. This limitation matters more every year as Kubernetes adoption grows and more organizations run significant portions of their production infrastructure on container orchestration platforms. For teams in this position, spreadsheet-based cloud cost management does not just underperform. It is structurally incapable of providing the visibility they need.
Why You Need a Dedicated Cloud Cost Management Platform — and Why Holori Was Built for This
Spreadsheets impose a manual process. The solution is not a better spreadsheet. It is a tool designed around how cloud billing actually works.
This is precisely the problem Holori was designed to solve.
Holori is a cloud cost management and FinOps platform that connects directly to your cloud accounts such as AWS, Azure, GCP, OCI, Kubernetes… It replaces the entire spreadsheet workflow with automated, real-time visibility. Rather than waiting for a monthly CSV export and spending days cleaning data, Holori ingests your billing data continuously and normalizes it across providers into a single, coherent view. From day one, you can see your total cloud spend across every account, region, and service.
Where spreadsheets collapse doing cost allocation, Holori introduces virtual tags. A mechanism that lets you define allocation rules and business dimensions that work even when your actual cloud tags are incomplete or inconsistent. You can map spend to teams, products, environments, or any organizational structure you care about, and those mappings apply automatically going forward. Shared resource costs can be split using configurable ratios that reflect actual usage.
Holori’s infrastructure view goes a step further than most cost dashboards. Because it makes your actual resource inventory visible. You don’t just see what you spend, it maps to your architecture with accurate infra diagrams.
On the alerting side, Holori lets you define budgets at any level of granularity and sends real-time alerts when spend deviates from expectations.
By implementing Holori, you save time, energy, keep everyone aligned . The result is a FinOps workflow that scales with your infrastructure rather than against it.
Knowing When You Have Outgrown the Spreadsheet
There is no universal threshold at which a spreadsheet stops working for cloud cost management, but there are reliable signals. If your team spends more than a few hours per month collecting, cleaning, and reconciling billing data before analysis, you have outgrown the spreadsheet. Then, if you cannot answer “what did this team spend last week?” without a manual effort, you have outgrown it. Or if your cloud cost allocation model is understood by fewer than three people, you have outgrown it. If you have ever discovered a significant cost anomaly more than a week after it started, you have outgrown it.
The good news is that the tooling has matured significantly. Dedicated cloud cost management platforms are no longer just for large enterprises. Solutions like Holori are designed to be accessible to teams at earlier stages of cloud maturity, with pricing and onboarding models that make the transition practical without requiring a large FinOps team or a long implementation project.
Conclusion
Spreadsheets are not bad tools. They are excellent tools applied to a problem they were not designed to solve. Cloud billing data is too large, too dynamic, and too structurally complex for a static, manually-maintained document. Cost allocation across modern infrastructure with multi-cloud, containerized, shared resources, requires logic that should run automatically. Real-time cost visibility requires continuous data feeds, not monthly CSV exports.
The organizations that manage cloud costs most effectively are the ones invested in tools that match the actual shape of the problem.
If your team is at that inflection point, the path forward is clear. Automate the data ingestion, enforce consistent allocation, and give every stakeholder the real-time visibility they need to make better decisions. That is exactly what modern cloud cost management such as Holori will help you achieve.
You can explore Holori’s cost visibility and allocation capabilities at holori.com/cloud-cost-dashboard, or book a demo to see how it maps to your specific cloud environment.