Most FinOps teams start tracking KPIs the same way they started using the cloud: by grabbing whatever is available. Total cloud spend goes into a dashboard, utilization rates get pulled from native consoles, and someone pastes the savings plan coverage percentage into a quarterly slide. Three months later, leadership asks whether cloud costs are under control, and the honest answer is: we have numbers, but we are not sure what they mean.
The problem is not a lack of metrics. Cloud providers surface hundreds of data points. The problem is tracking the wrong metrics for where your organization actually is in its FinOps journey, or tracking too many at once without understanding what action each one is supposed to trigger.
This guide organizes the most important FinOps KPIs into three functional groups: visibility metrics that tell you where money goes, optimization metrics that tell you how efficiently it is spent, and business alignment metrics that connect cloud spend to outcomes. Within each group, we explain what the metric measures, how to calculate it, and what a healthy target looks like.
Why FinOps KPIs Matter Beyond the Cloud Bill
Cloud billing data in its raw form is not actionable. A monthly AWS invoice might run to hundreds of line items across dozens of services, accounts, and regions. Without a defined measurement framework, teams spend their time explaining what happened rather than preventing it from happening again.
FinOps KPIs create a shared language between engineering, finance, and leadership. When a VP of Engineering and a CFO are both looking at the same coverage rate or the same cost per active user, conversations shift from “why is the cloud bill so high” to “here is where we are investing and here is the return.” That alignment is the actual output a FinOps program is trying to produce.
A secondary benefit is accountability. When a metric is owned by a specific team and reviewed on a cadence, behavior changes. Engineers start thinking about resource sizing before they provision. Product managers start asking what their feature costs to run. Finance stops treating cloud spend as an undifferentiated line item.
Visibility FinOps KPI
These are the foundation. Before optimizing anything, you need to know who is spending what, on which services, and whether the data is reliable enough to act on.
Cost Allocation Rate
This measures the percentage of total cloud spend that has been attributed to a specific owner: a team, a product, a business unit, or a cost center.
Cost Allocation Rate = (Allocated Spend / Total Cloud Spend) x 100
A mature FinOps program targets 90% or above. Anything below 80% means a significant portion of the bill is sitting in shared or untagged buckets, which makes chargeback, showback, and forecasting unreliable downstream.
The most common obstacle here is tagging compliance. Resources get created without required tags, especially by automated pipelines or third-party tools, and the billing data arrives unattributable. Teams that cannot reach a high allocation rate without fixing their tagging practice often benefit from virtual tagging, which allows cost allocation rules to be applied retroactively without touching the underlying infrastructure.
Tagging Coverage Rate
Closely related to allocation rate but measured at the resource level rather than the spend level. It answers the question: what percentage of cloud resources carry the required tags?
Tagging Coverage Rate = (Tagged Resources / Total Resources) x 100
Because some resources cost far more than others, it is useful to track tagging coverage weighted by spend, not just by resource count. A single untagged EC2 cluster can skew allocation data far more than a thousand untagged Lambda invocations.
Forecast Accuracy Rate
Measures how closely projected cloud spend aligns with actual costs over a specific timeframe, typically monthly. Tracking this KPI helps finance and engineering teams identify forecasting gaps and strengthen future budget planning.
Forecast Accuracy = 1 – (|Actual Spend – Forecasted Spend| / Forecasted Spend)
A well-functioning FinOps program targets forecast accuracy above 90% on a monthly basis. Large deviations almost always trace back to either unmonitored services launching unexpected workloads, or to anomalous events that a solid alerting setup would have caught earlier.
Optimization FinOps KPI
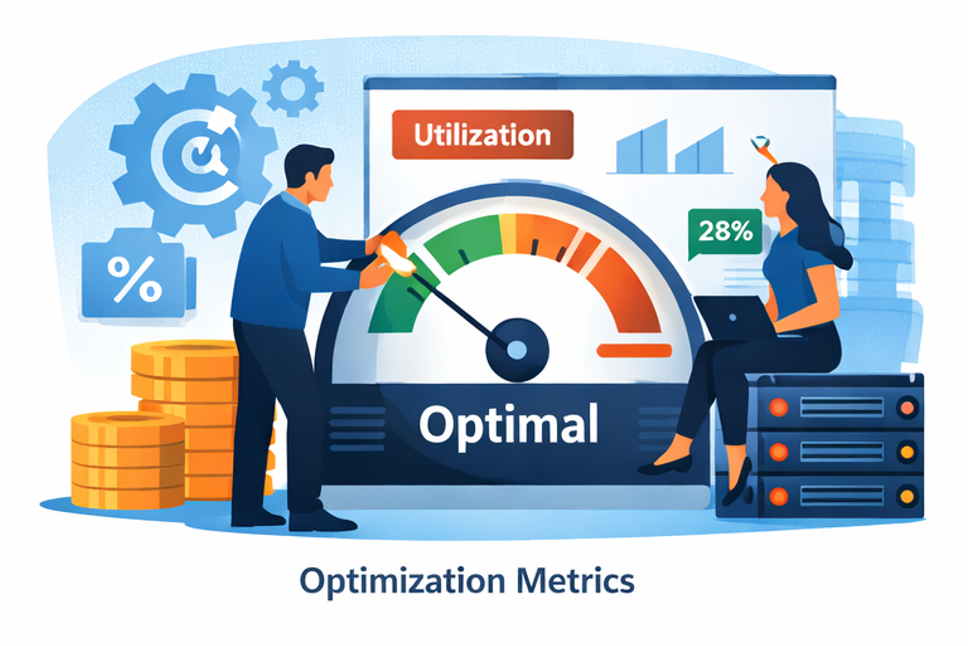
Once visibility is established, the focus shifts to efficiency. These metrics tell you how well provisioned your infrastructure is and how effectively you are using commitment-based discounts.
Resource Utilization Rate
Measures the fraction of provisioned compute capacity actually being used over a defined period.
Utilization Rate = (Average Resource Consumption / Provisioned Capacity) x 100
A healthy target varies by workload type. Batch jobs and data pipelines can tolerate 80 to 90% utilization. Customer-facing services often need headroom for traffic spikes, making 50 to 70% more appropriate. The key is defining targets by workload category rather than applying a single threshold across the entire environment.
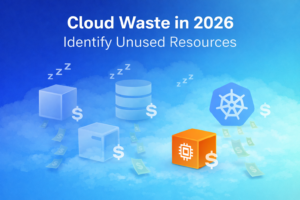
Cloud Waste Rate
Waste includes idle resources (instances running but serving no traffic), orphaned resources (storage volumes or snapshots detached from any active workload), and oversized resources with consistent utilization well below their provisioned capacity. Industry estimates consistently place cloud waste between 25 and 35% of total spend for organizations without an active optimization program.
Cloud Waste Rate = (Wasted Spend / Total Cloud Spend) x 100
Tracking this metric over time is more valuable than the absolute number. A waste rate that drops from 28% to 18% over two quarters reflects a program that is working.
Commitment Coverage Rate and Commitment Lock-In Risk
Reserved Instances, Savings Plans, and Committed Use Discounts offer substantial discounts, typically 30 to 60% compared to on-demand pricing, in exchange for a usage commitment. Coverage rate measures what fraction of eligible spend is covered by one of these instruments.
Commitment Coverage Rate = (Commitment-Covered Spend / Eligible On-Demand Spend) x 100
A well-managed environment typically targets 70 to 85% coverage on stable workloads. But coverage rate alone tells only half the story. Every commitment also carries lock-in risk: the longer the term, the more exposed you are if workloads shrink or shift.
Commitment Lock-In Risk (CLR) quantifies this exposure in months. It reflects how long you are tied to a specific level of usage to realize the savings from your commitments. A high coverage rate paired with a high CLR means you have locked in significant capacity that may become wasteful if usage patterns change. Both metrics need to be reviewed together when making purchasing decisions.
Effective Savings Rate (ESR)
The Effective Savings Rate is a FinOps Foundation standard metric that calculates the percentage savings achieved compared to what the same usage would have cost at on-demand rates. Unlike coverage rate, which measures the reach of your discount instruments, ESR measures their actual financial impact.
ESR = Cloud Savings from Rate Optimization / On-Demand Equivalent Spend
ESR is the clearest single indicator of how well your discount strategy is performing. It accounts for all instruments together: Reserved Instances, Savings Plans, CUDs, spot usage, and any negotiated discounts. Teams with a mature commitment strategy typically achieve an ESR between 20 and 40% depending on workload stability and cloud mix. Tracking ESR over time validates whether optimization efforts are compounding or stagnating.
Anomaly-Detected Cost Avoidance
Identifying a cost anomaly is not the same as avoiding its cost. This metric measures the estimated savings from catching and resolving unexpected cost spikes before they continue to accrue across a full billing cycle.
Anomaly-Detected Cost Avoidance = Total Unexpected Cost x Potential Duration of Anomaly (in Days)
A runaway job or misconfigured autoscaling group that goes undetected for a week can generate far more waste than a month of gradual inefficiency. Tracking what anomaly detection actually prevented, not just what it flagged, creates a concrete business case for investing in alerting infrastructure.
Effective Avoidance Rate (EAR)
Where ESR measures savings from rate optimization (better pricing), EAR measures savings from workload optimization (using less). It quantifies how much cost was avoided through actions like stopping idle resources, rightsizing instances, deleting orphaned storage, or reconfiguring underused workloads.
EAR = (Pre-Optimization Cost – Post-Optimization Cost) / Pre-Optimization Cost
EAR complements ESR by capturing the engineering side of cloud efficiency. An organization can have a strong ESR from well-managed commitments but a weak EAR because rightsizing recommendations are never acted on. Tracking both together gives a complete picture of whether the FinOps program is capturing savings at both the pricing and usage layers.
Business FinOps KPI
These are the metrics that matter most to leadership, and the ones most FinOps programs take the longest to implement because they require correlating cloud cost data with business data that lives outside the billing system.
Cloud Spend as a Percentage of Revenue
This normalizes cloud cost relative to the size of the business, which makes it meaningful across time periods and between companies.
Cloud Spend as % of Revenue = (Total Cloud Spend / Total Revenue) x 100
For SaaS companies, benchmarks typically fall between 8 and 20% depending on growth stage and architecture. If the ratio is increasing at a mature company, that is a signal worth investigating regardless of how the absolute spend looks.
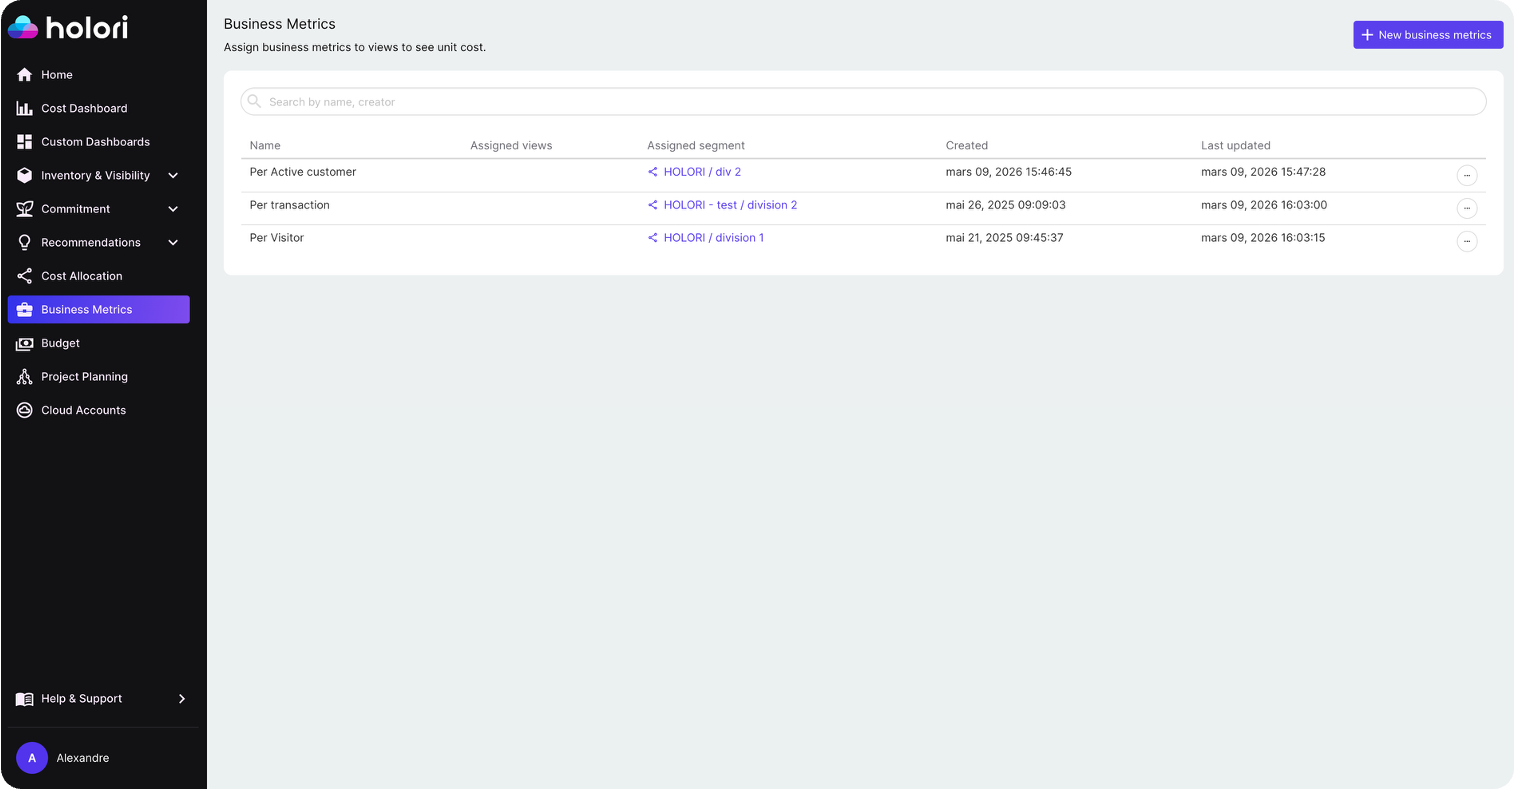
Unit Cost Metrics
Unit economics translate cloud spend into terms that product and business teams can understand and act on. The right unit metric depends on the business model.
Unit Cost = Total Cloud Spend for a Workload / Number of Units Produced
Common units include cost per active user, cost per transaction, cost per API call, and cost per gigabyte processed. Unit cost metrics are also the most effective way to separate growth-driven cost increases from inefficiency-driven ones. If cloud spend doubles but active users also double, unit cost is flat and the business is scaling efficiently. If cloud spend doubles while users grow 20%, unit cost has nearly doubled and something needs to change.
Starting With the Right FinOps KPIs for Your Maturity Level
Not all of these metrics are appropriate to track at once. For teams at an early stage of FinOps adoption, cost allocation rate and tagging coverage are the right place to start. Without reliable attribution data, all downstream metrics are unreliable.
Mid-stage teams should layer in waste rate, utilization rate, ESR, and commitment coverage. These drive the largest savings in absolute terms and are achievable with data already available in most FinOps platforms. EAR and anomaly cost avoidance belong here too, once optimization recommendations are being acted on consistently.
Mature programs can then move to unit economics and business alignment metrics, which require correlating billing data with product and revenue data but deliver the clearest picture of cloud investment efficiency.
The mistake most teams make is trying to build unit cost metrics before they have reliable cost allocation. The metrics need to be built in order.
How Holori Surfaces These FinOps KPIs

Holori is built to give FinOps teams visibility across all three groups. Cost allocation rate and tagging coverage are surfaced natively with support for virtual tags, which let you apply allocation rules across AWS, Azure, GCP, and other providers without requiring changes to how resources are tagged at the infrastructure level. This matters in practice because most multi-cloud environments have inconsistent tagging practices across providers, and virtual tagging bridges the gap without blocking engineering teams.
Commitment coverage and utilization rates are tracked across AWS Savings Plans, Reserved Instances, Azure Reservations, and GCP Committed Use Discounts in a single view, so you can assess cross-cloud commitment efficiency without switching between native consoles.
Anomaly detection helps close the gap between forecasted and actual spend by flagging unexpected cost movements in real time, feeding directly into your anomaly-detected cost avoidance metric and giving teams the chance to investigate before a spike compounds across a full billing cycle.
For teams tracking AI spend specifically, Holori also surfaces cost metrics by AI provider including AWS Bedrock, Vertex AI, and Azure OpenAI with the same allocation and normalization logic applied to the rest of the infrastructure, making it possible to build unit cost metrics for AI workloads alongside traditional cloud spend.
The right FinOps metrics program does not start with a list of 27 KPIs. It starts with a clear answer to the question: what decision is this metric supposed to help us make? Build from there, and the metrics that matter will follow.
Get those FinOps KPIs now with Holori: https://app.holori.com/