Cloud spending rarely increases in a straight line. Costs spike overnight, workloads spin up without approval, a misconfigured autoscaling group quietly consumes resources across three regions, and by the time the finance team flags the invoice, the damage is already done. Cloud cost anomaly detection is the discipline that closes that gap. It gives engineering, FinOps, and finance teams the ability to identify unexpected deviations in cloud spend before they compound into serious budget overruns.
This article explains what cloud cost anomaly detection is, how it works technically, where organizations most often fail at it, and how a modern multi-cloud FinOps platform turns anomaly management into a reliable, continuous practice.
What Is a Cloud Cost Anomaly?

According to the FinOps Foundation, anomalies in the context of FinOps are unpredicted variations in cloud spending that are larger than would be expected given historical spending patterns. That definition is more useful than it might first appear, because it draws a clear line between genuine anomalies and expected fluctuations. A cost increase is not automatically an anomaly. A planned deployment, a product launch, or a seasonal traffic surge will all produce higher bills without constituting a problem. The challenge is distinguishing those events from the ones that are truly unexpected: a developer left a GPU instance running over a long weekend, a data pipeline is duplicating transfers due to a code bug, or a forgotten test environment has been accumulating charges for weeks.
Anomaly management is the ability to detect, identify, clarify, alert, and manage unexpected or unforecasted cloud cost events in a timely manner, in order to minimize detrimental impact to the business, cost or otherwise. At its core, it requires a continuous loop of detection, investigation, resolution, and reporting. When that loop is broken or delayed at any stage, costs accumulate and root causes become harder to trace.
Why Anomaly Detection Is Now a Core FinOps Capability
Enterprises estimate around 27% of cloud spend is wasted. Anomaly-driven triage finds the runaways, including GPU bursts, NAT egress, and stuck jobs, and converts them into savings tickets with dollar impact. Those categories of waste are not hypothetical. They represent real, recurring failure modes that show up in organizations of every size, from fast-growing startups to large enterprises managing hundreds of accounts.
The speed of detection matters as much as the detection itself. Organizations operating at a FinOps “Run” maturity level are aware of unexpected cost increases within hours. Those at a “Walk” maturity take up to a day or multiple days to identify them. Organizations at the “Crawl” level may be unaware for a week or more. In a cloud environment where a single misconfigured resource can generate thousands of dollars in charges per day, that gap between crawl and run represents a material financial risk.
Beyond direct cost savings, anomaly detection also plays a role in security and reliability. Organizations can even identify and prevent security and reliability incidents that surface in cost data. An unexpected spike in data egress, for example, may indicate exfiltration rather than a billing error. Cloud cost data, when monitored carefully, doubles as an operational signal.
How Cloud Cost Anomaly Detection Works
The technical process behind anomaly detection follows three sequential steps: estimation, prediction, and detection. Understanding each one helps FinOps teams evaluate tooling and interpret the alerts they receive.
During the estimation phase, the system builds a mathematical model of what normal spending looks like. That model must account for trends, weekly and monthly seasonal patterns, and the effect of known events such as product launches, holidays, or planned infrastructure changes. A simple model might calculate a seven-day rolling average and standard deviation. A more sophisticated one will encode seasonality explicitly so that a predictable Monday spike, driven by weekend workloads resuming, does not trigger a false positive every week.
During the prediction phase, the model uses all data up to the previous time step to generate an expected cost for the next interval, typically a day, along with a confidence interval around that prediction. That confidence interval, sometimes called the baseline sleeve, defines the zone of normal behavior. A cost measurement is only considered anomalous if it falls outside that range, not merely above a fixed threshold.
Detection fires when the actual cost deviates significantly from the predicted confidence interval. At that point, the system creates an anomaly record and triggers the notification workflow. The quality of both the estimation model and the confidence interval directly determines how useful those alerts are in practice. A model that does not account for seasonality will generate false positives on a predictable schedule. A model that sets its confidence interval too narrowly will fire constantly. Calibrating those parameters is an ongoing practice, not a one-time setup.
Severity, Latency, and the Real Operational Challenges
Not all anomalies are equal, and treating them as if they are is one of the most common ways anomaly programs break down operationally. Anomalies should be classified by severity, typically across a low, medium, high, and critical scale, so that response workflows are proportionate. A 3% cost increase in a low-traffic service does not warrant the same response as a 200% spike in a production database. Importantly, a low-severity anomaly can escalate to critical as costs accumulate over hours and days if it is left unaddressed. A daily alert that looks minor in isolation may represent thousands of dollars of waste by the end of the week.
Latency is a second challenge that is rarely discussed but has significant practical consequences. Cloud billing data from providers can be delayed by up to 36 hours from the time a cost event occurs. For short-duration anomalies, this means the event may already be over by the time any alert fires. For long-duration anomalies, costs can grow substantially during the gap between occurrence and detection. The practical response to this constraint is to run anomaly detection even on incomplete data, then reapply it as billing data is updated, rather than waiting for a complete dataset before analyzing. Systems that supplement billing data with resource utilization metrics can detect anomalies earlier because they do not depend on the billing pipeline being fully settled.
The scope and aggregation level at which detection runs also introduces complexity, particularly in large or multi-cloud environments. An anomaly that is invisible at the organization level because it is absorbed by overall spending may be immediately obvious at the service or tag level. Starting at a higher aggregation level and progressively drilling down as the program matures is a practical approach, but the end goal is detection at the granularity of individual services, accounts, regions, and cost allocation tags.
Unit Economics Anomaly Detection
Standard cost anomaly detection monitors raw spending, which means it cannot distinguish between a cost increase that reflects healthy business growth and one that reflects genuine inefficiency. Unit economics anomaly detection solves that problem by monitoring the ratio between cost and a business output metric, such as cost per active user, cost per order, or cost per API call.
Consider a holiday sale that drives a surge in web traffic and causes cloud costs to increase significantly across compute, database, and CDN services. A raw cost anomaly system will flag that increase as a potential anomaly because it deviates from the historical baseline. A unit economics system, however, will observe that the cost per transaction has remained stable, and correctly conclude that the cost increase is proportionate to the business activity driving it. No alert is necessary. The same logic works in reverse: if unit costs rise while business volume stays flat, that deviation is a strong signal of inefficiency, misconfiguration, or resource waste that warrants immediate investigation.
This distinction between what might be called good and bad cost increases is one of the most valuable things a mature FinOps program can offer to finance and leadership. It reframes anomaly management from a purely defensive, cost-cutting activity into a business intelligence function that connects infrastructure spending to revenue outcomes. Organizations running at full FinOps maturity extend their anomaly detection models beyond raw cloud costs to include these calculated unit economics metrics, which gives finance teams the context they need to adjust forecasts accurately and avoid treating normal growth as a crisis.
The Multi-Cloud Anomaly Detection Challenge

Most organizations today are not running on a single cloud. They operate across AWS, Azure, and Google Cloud simultaneously, often with different teams owning different environments on different platforms. This fragmentation is one of the most significant obstacles to effective anomaly detection.
Large and multi-cloud organizations face the additional challenge of mapping anomalies to their organization structure. Forecasts and budgets are often set at the business or department level, creating the need to align cloud costs with budgets for cost-based anomaly detection. When a spike occurs on AWS, determining whether it belongs to the product team, the data engineering team, or a shared infrastructure account requires precise cost allocation data. Without it, anomaly alerts land in a shared inbox and get ignored.
In large or multi-cloud organizations, mapping an anomaly back to its business context is tricky. You need to align anomalies with organizational units, cloud accounts, and service tags to detect what actually matters to your cost model. Each cloud provider uses different billing structures, service naming conventions, and tag schemas, which makes normalizing data across clouds a prerequisite for meaningful anomaly detection, not an optional enhancement.
Native tools from AWS, Azure, and Google Cloud each offer anomaly detection capabilities within their own ecosystems. AWS Cost Anomaly Detection can monitor cost categories and allocation tags across organizational member accounts. AWS managed monitors can track all values in a dimension with a single monitor, and new resources are automatically included as an organization grows, ensuring anomalies are caught before they impact budgets. Google Cloud’s anomaly detection is zero-config and runs hourly on billing accounts, flagging deviations by actual versus expected spending, ranking top contributors, and pushing alerts via email or Pub/Sub. Azure Cost Management offers subscription-level anomaly alerts with integration into Teams and email notifications.
The limitation of relying on native tools alone is that each provider sees only its own data. An organization that needs to compare a cost spike on Azure against normal patterns driven by a GCP workload migration cannot do that within any single provider’s console. The context is siloed by design.
From Alert to Resolution: The Anomaly Lifecycle
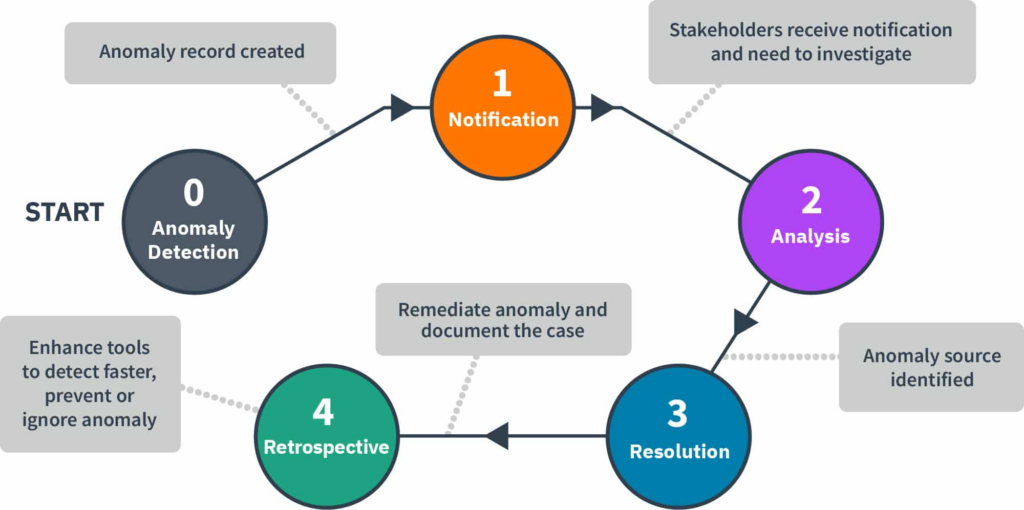
Detecting an anomaly is the beginning of the process, not the end. FinOps practitioners manage the anomaly lifecycle from detection through resolution and retrospection, ensuring cross-team accountability. Product owners collaborate with engineering on root cause analysis and corrective actions. Engineering implements fixes, optimizes resources, and provides technical insights. Finance adjusts forecasts, tracks cost deviations, and ensures financial alignment.
That multi-persona involvement is not a bureaucratic recommendation. It reflects a practical reality: the person who can identify the source of an anomaly is usually an engineer, the person who can authorize a budget adjustment is usually in finance, and the person who needs to track resolution is usually a FinOps practitioner. Any anomaly workflow that does not route the alert to the right person at the right time will stall.
Owner-mapped alerts, segmented by application, team, and environment, mean the first notification reaches the responsible engineer rather than a shared inbox. With cost visibility still the top pain point for 84% of organizations, routing to the accountable owner shortens the time from “what changed?” to action. The operational goal is not just detection speed but resolution speed. A two-minute detection followed by a two-week resolution is still a costly outcome.
After resolution, the full value of anomaly management is realized through retrospection. The total cost avoidance achieved through anomaly detection should be communicated to the wider FinOps team as part of regular cost reporting practices, as well as to the cloud operations team including product managers, engineers, and engineering leaders, to better inform future infrastructure planning. Quantifying what was saved through early detection gives the FinOps function a concrete way to demonstrate business value.
Reducing False Positives: The Noise Problem
One of the most common failure modes in anomaly detection programs is alert fatigue. When detection models are too sensitive, or when expected cost events are not accounted for, engineers receive so many false positive alerts that they begin ignoring the system entirely. A high-noise detection program is arguably worse than no program at all, because it creates a false sense of security while consuming team time with meaningless investigations.
Expected cost spikes, where investigation confirms that the increase was an anticipated event caught by anomaly detection algorithms, are a normal output of any active detection system. The goal is not to eliminate alerts about planned events but to categorize and suppress them efficiently so that genuine anomalies remain visible. Tuning detection sensitivity is an ongoing practice, not a one-time configuration.
Platforms that allow you to set impact thresholds and feedback loops help ensure only meaningful anomalies page people. FinOps teams that tune sensitivity and suppress known events consistently hold false-positive rates in single digits, which becomes an operational service level objective you can enforce. Reaching that level of precision requires feedback mechanisms that let teams mark alerts as expected, learn from those markings, and continuously refine the model’s understanding of normal.
How Holori Approaches Cloud Cost Anomaly Detection
Holori’s anomaly detection engine analyzes historical billing data across your entire multi-cloud footprint to surface cost deviations automatically, covering both cost increases and decreases. Rather than requiring engineers to manually review dashboards, Holori continuously scans your most frequently used tags, services, cost centers, and virtual tags, and delivers alerts directly to the channels your teams already work in, including Slack and email.
Every newly created virtual tag in Holori automatically includes an anomaly scan. This matters because cost allocation and anomaly detection are deeply connected: the moment you restructure your costs through a new virtual tag, Holori begins monitoring that dimension for unexpected behavior without requiring any additional configuration. You get a holistic view of your data from day one.
Holori supports two types of anomaly alerts. Predefined anomalies cover the most significant cost groups out of the box across AWS, Azure, and GCP, including dimensions like region, sub-service, account name, charge type on AWS; service family, meter subcategory, and consumed service on Azure; and project, SKU description, and folder on GCP. For AI workloads specifically, Holori tracks anomalies across OpenAI project IDs and models, Anthropic workspaces and token types, and equivalent dimensions on Bedrock and Vertex AI. These predefined monitors can be toggled on or off and customized to match your specific requirements.
Custom anomaly alerts give teams full control over detection logic. You can define your own alert name, cost type, filters, and grouping dimensions, then set thresholds by both percentage deviation and minimum dollar amount. Setting a threshold of 20% with a floor of $20, for example, ensures that only statistically meaningful and financially significant deviations trigger a notification. After defining your grouping and filters, Holori surfaces the associated values and lets you activate or deactivate each one individually, so the alert matches exactly what your team cares about.

The Anomalies Feed gives practitioners a single place to investigate, filter, comment on, and manage every active anomaly. From any anomaly in the feed, a single click opens your cost explorer with the relevant filters pre-populated, so investigation starts immediately rather than requiring manual reconstruction of the query.
Building a Mature Cloud Anomaly Detection Practice
Effective anomaly detection does not arrive pre-configured. It is a capability that organizations build incrementally, starting with basic alerting and maturing toward fully owner-routed, ML-driven detection with suppression rules and retrospective reporting.
The starting point is visibility. You cannot detect anomalies in data you are not collecting, and you cannot route alerts to owners whose costs are not allocated. Getting cost allocation right, through proper tagging or virtual tagging, is the prerequisite for everything else. Once visibility is established, threshold-based alerts provide an immediate safety net. As more historical data accumulates, statistical and ML-based baselines produce better signal with less noise. And as teams adopt the practice, the feedback loop between detection and suppression refines the system toward a sustainable operational rhythm.
A systematic approach to anomaly detection, analysis, and resolution allows organizations to minimize unexpected costs that impact budgets and business operations, and to promote knowledge sharing and cross-functional collaboration that drives continuous improvement in detection and response capabilities.
Cloud cost anomaly detection is not a feature you turn on. It is a practice you build, with the right data foundation, the right tooling, and the right organizational alignment. Holori provides the multi-cloud cost visibility layer that makes all three possible.

FAQ
What is the difference between a budget alert and a cost anomaly alert?
A budget alert fires when your total spend crosses a predefined threshold, for example when you have consumed 80% of your monthly budget. It tells you how much you have spent but not why. A cost anomaly alert is more surgical: it detects statistically unusual patterns at the service, account, region, or tag level and flags the specific deviation, which makes root cause analysis much faster. Budget alerts are a safety net; anomaly alerts are an investigative tool.
How do I set up cloud cost anomaly detection on AWS?
AWS offers a native service called AWS Cost Anomaly Detection, available through the AWS Cost Management console. You create a monitor that tracks either a specific cost category, linked account, cost allocation tag, or service. AWS then uses machine learning to establish a spending baseline and sends alerts via email or SNS when a deviation exceeds your configured threshold. For organizations with multiple accounts, an organizational monitor automatically includes new accounts as they are added.
How quickly should I expect to detect a cloud cost anomaly?
Detection speed depends on your FinOps maturity level. Organizations at an advanced level typically identify unexpected cost increases within hours. Less mature organizations may take a day or more, and some discover anomalies only when reviewing the monthly invoice. The goal is to reach a state where anomalies are surfaced and routed to the responsible owner on the same day they occur, which requires both automated detection and well-structured cost allocation.
Does cloud cost anomaly detection work across multiple clouds?
Native provider tools, such as AWS Cost Anomaly Detection or Google Cloud’s billing anomaly alerts, only see data from their own platform. For organizations running workloads across AWS, Azure, and GCP simultaneously, a multi-cloud FinOps platform like Holori is necessary to detect anomalies in a unified view, normalize billing data across providers, and route alerts with full organizational context regardless of which cloud the spike originated from.
How do I reduce false positives in cost anomaly alerts?
The most effective approach is to combine threshold tuning with a feedback loop. Mark expected cost events, such as planned deployments or seasonal traffic increases, as known so the detection model learns to suppress them. Applying impact thresholds ensures that only deviations above a meaningful dollar amount trigger alerts. Over time, a well-tuned system can keep false positive rates in single digits, which is the point at which anomaly alerts are genuinely actionable rather than background noise.