AWS EC2 is often the largest line item on a cloud bill. Yet most teams struggle to answer basic questions: why did this instance cost more this month? Which usage component is driving the bill? How does today’s spend compare to six months ago?
This guide goes beyond theory. It covers how EC2 costs are actually structured, what data you need to analyze them properly, and how to build a reliable practice around monitoring and reducing that spend. We’ll then show you how tools like Holori give you the granular visibility that the AWS console alone cannot provide.
How AWS EC2 Pricing Actually Works
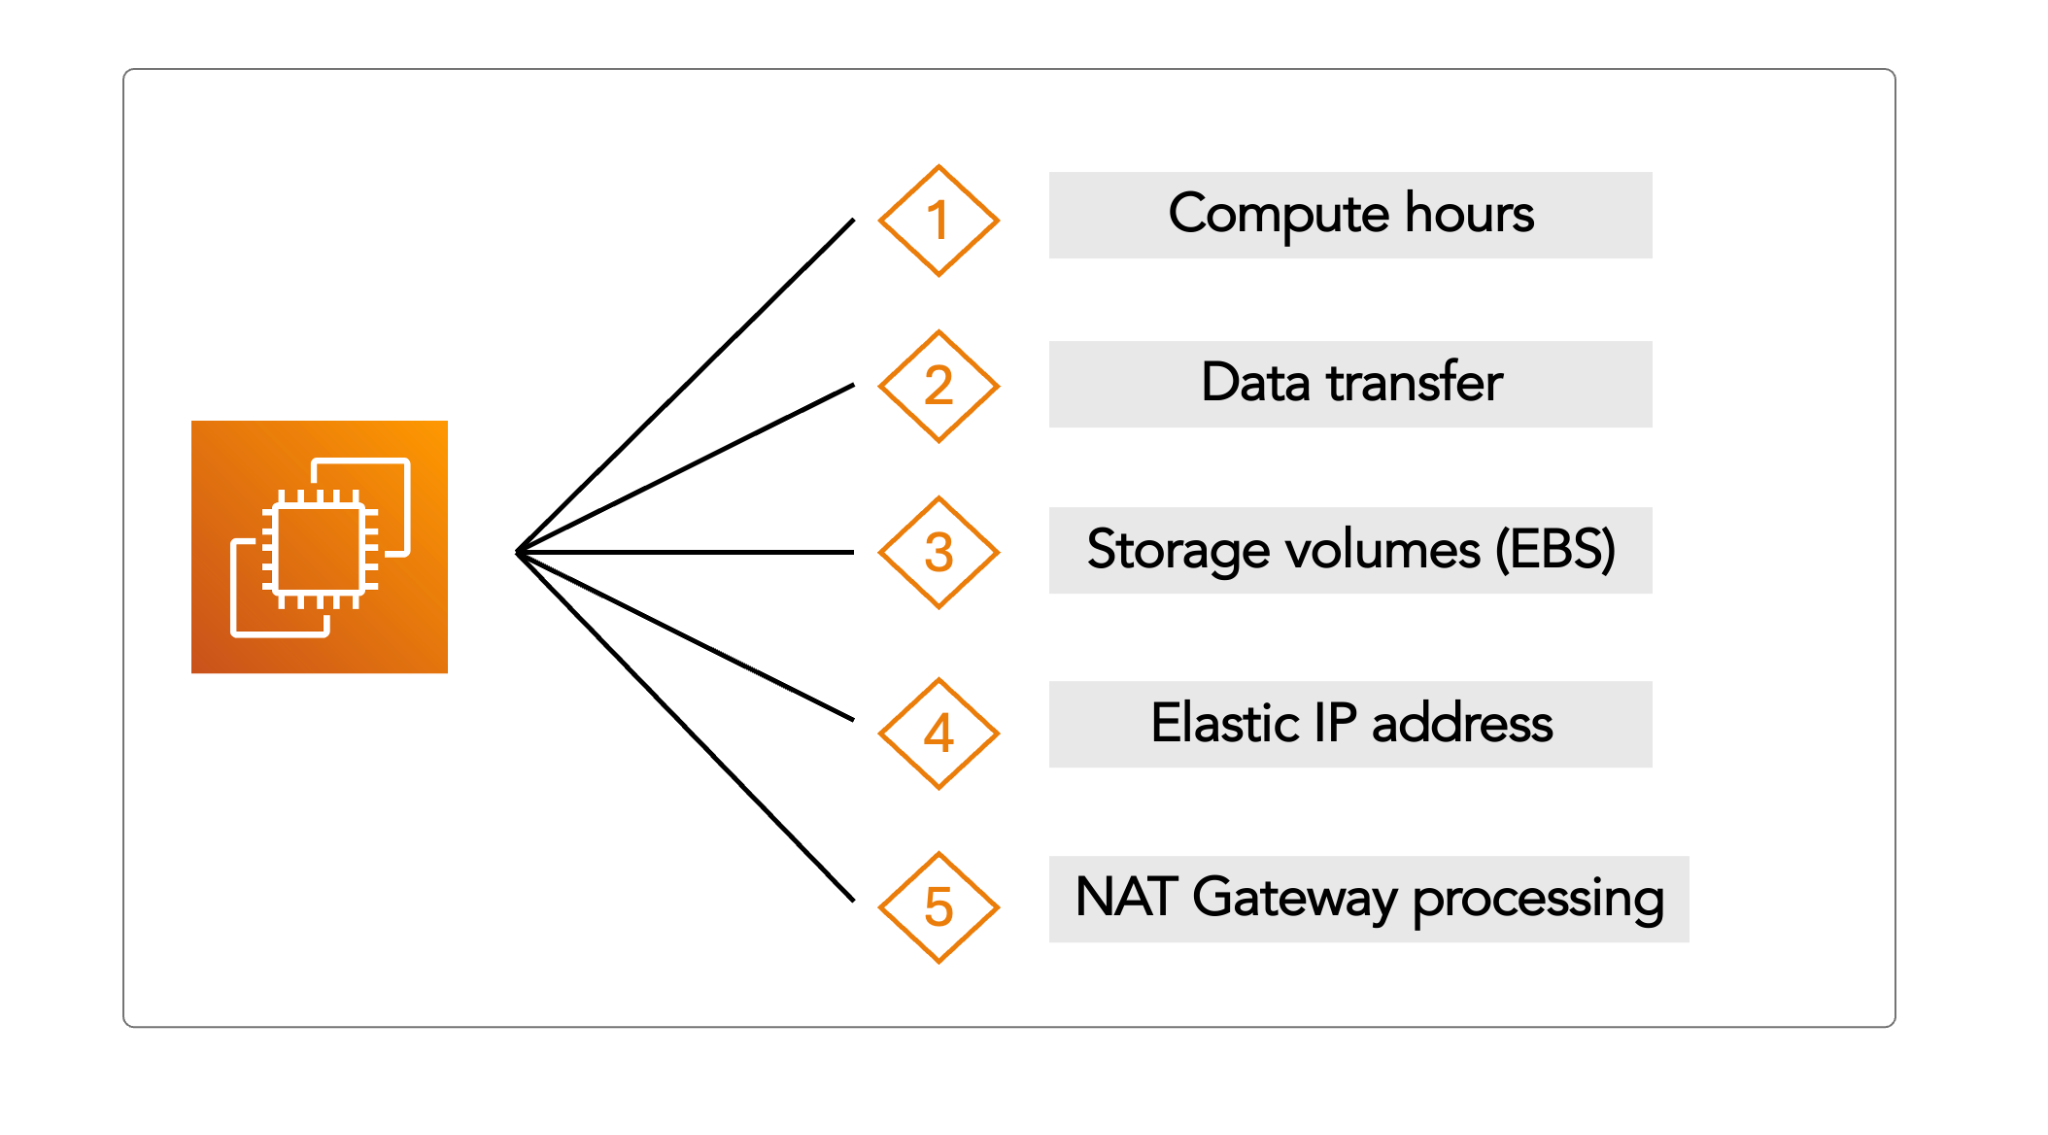
Before you can break down costs, you need to understand what creates them. EC2 pricing is not a single number. It is the sum of several distinct components that AWS bills separately.
Compute hours form the baseline. AWS charges per hour (or per second for Linux instances) based on the instance type, region, and operating system. A t3.medium in us-east-1 running Linux costs differently from the same instance type in eu-west-1 or running Windows.
Data transfer is frequently underestimated. Outbound traffic to the internet is billed per GB, and even cross-AZ traffic within the same region generates charges. Teams that run distributed architectures often find data transfer costs rival compute costs.
Storage volumes (EBS) attached to instances are billed independently. The type of volume (gp2, gp3, io1, io2) and the provisioned IOPS both affect the bill. An instance can be stopped and still accumulate EBS charges.
Elastic IP addresses that are allocated but not attached to a running instance are charged. This is a common source of waste.
NAT Gateway processing and other ancillary services often show up in the same bill sections as EC2, making it harder to isolate true compute costs.
Understanding this structure is step one. Step two is finding the data to measure each component with precision.
Below is the example of the cost break-down for an EC2 instance to host a webpage (one page of the AWS website).
Example of an EC2 cost-breakdown
| Characteristic | Estimated Usage | Description |
| Utilization | 100% | All infrastructure components run 24 hours per day, seven days per week |
| Instance | t3a.xlarge | 16 GB memory, 4 vCPU |
| Storage | Amazon EBS SSD gp2 | One Amazon EBS volume per instance with 30 GB of storage per volume |
| Data backup | Daily Amazon EBS snapshots | One Amazon EBS volume per instance with 30 GB of storage per volume |
| Data transfer | Data in: 1 TB/monthData out: 1 TB/month | 10% incremental change per day |
| Instance scale | 4 | On average per day, there are four instances running |
| Load Balancing | 20 GB/hour | ELB is used 24 hours per day, seven days per week. It processes a total of 20 GB/hour (data in and data out) |
| Database | MySQL, db.m5.large instance with 8 GB memory, 2 vCPUs, 100 GB storage | Multi-AZ deployment with synchronous standby replica in a separate Availability Zone |
The Problem With Default AWS Cost Visibility
The AWS Cost Explorer gives you a starting point, but it has real limitations when you want to analyze EC2 costs in depth.
By default, Cost Explorer shows blended costs across services. Drilling into a specific EC2 instance and seeing a clean breakdown of what drives its total cost requires navigating multiple views, applying tag filters, and often exporting raw Cost and Usage Report (CUR) data. The CUR file itself is a massive CSV with hundreds of columns which is powerful, but not practical for day-to-day analysis.
The native tooling also has a historical depth problem. Cost Explorer retains 13 months of data by default. For teams doing capacity planning or trying to understand seasonal patterns, that window is too short. Trend analysis over 24 or 36 months gives a fundamentally different picture of cost behavior.
Moreover, AWS default daily visibility is limited to the last 14 days only. This is way too short to build projections and analysis.
Finally, AWS shows costs in USD only. If you want to understand usage in the units that actually matter you can’t. If you need to see GB transferred, hours running, IOPS provisioned, you have to do the conversion yourself.
Breaking Down EC2 Costs: The Data Points You Need
A proper EC2 cost breakdown requires working with data at multiple levels simultaneously.
At the account level, you need to see total EC2 spend over time, split by region, by purchase type (On-Demand vs Reserved vs Spot), and by instance family. This gives you the macro picture and reveals where the concentration of spend sits.
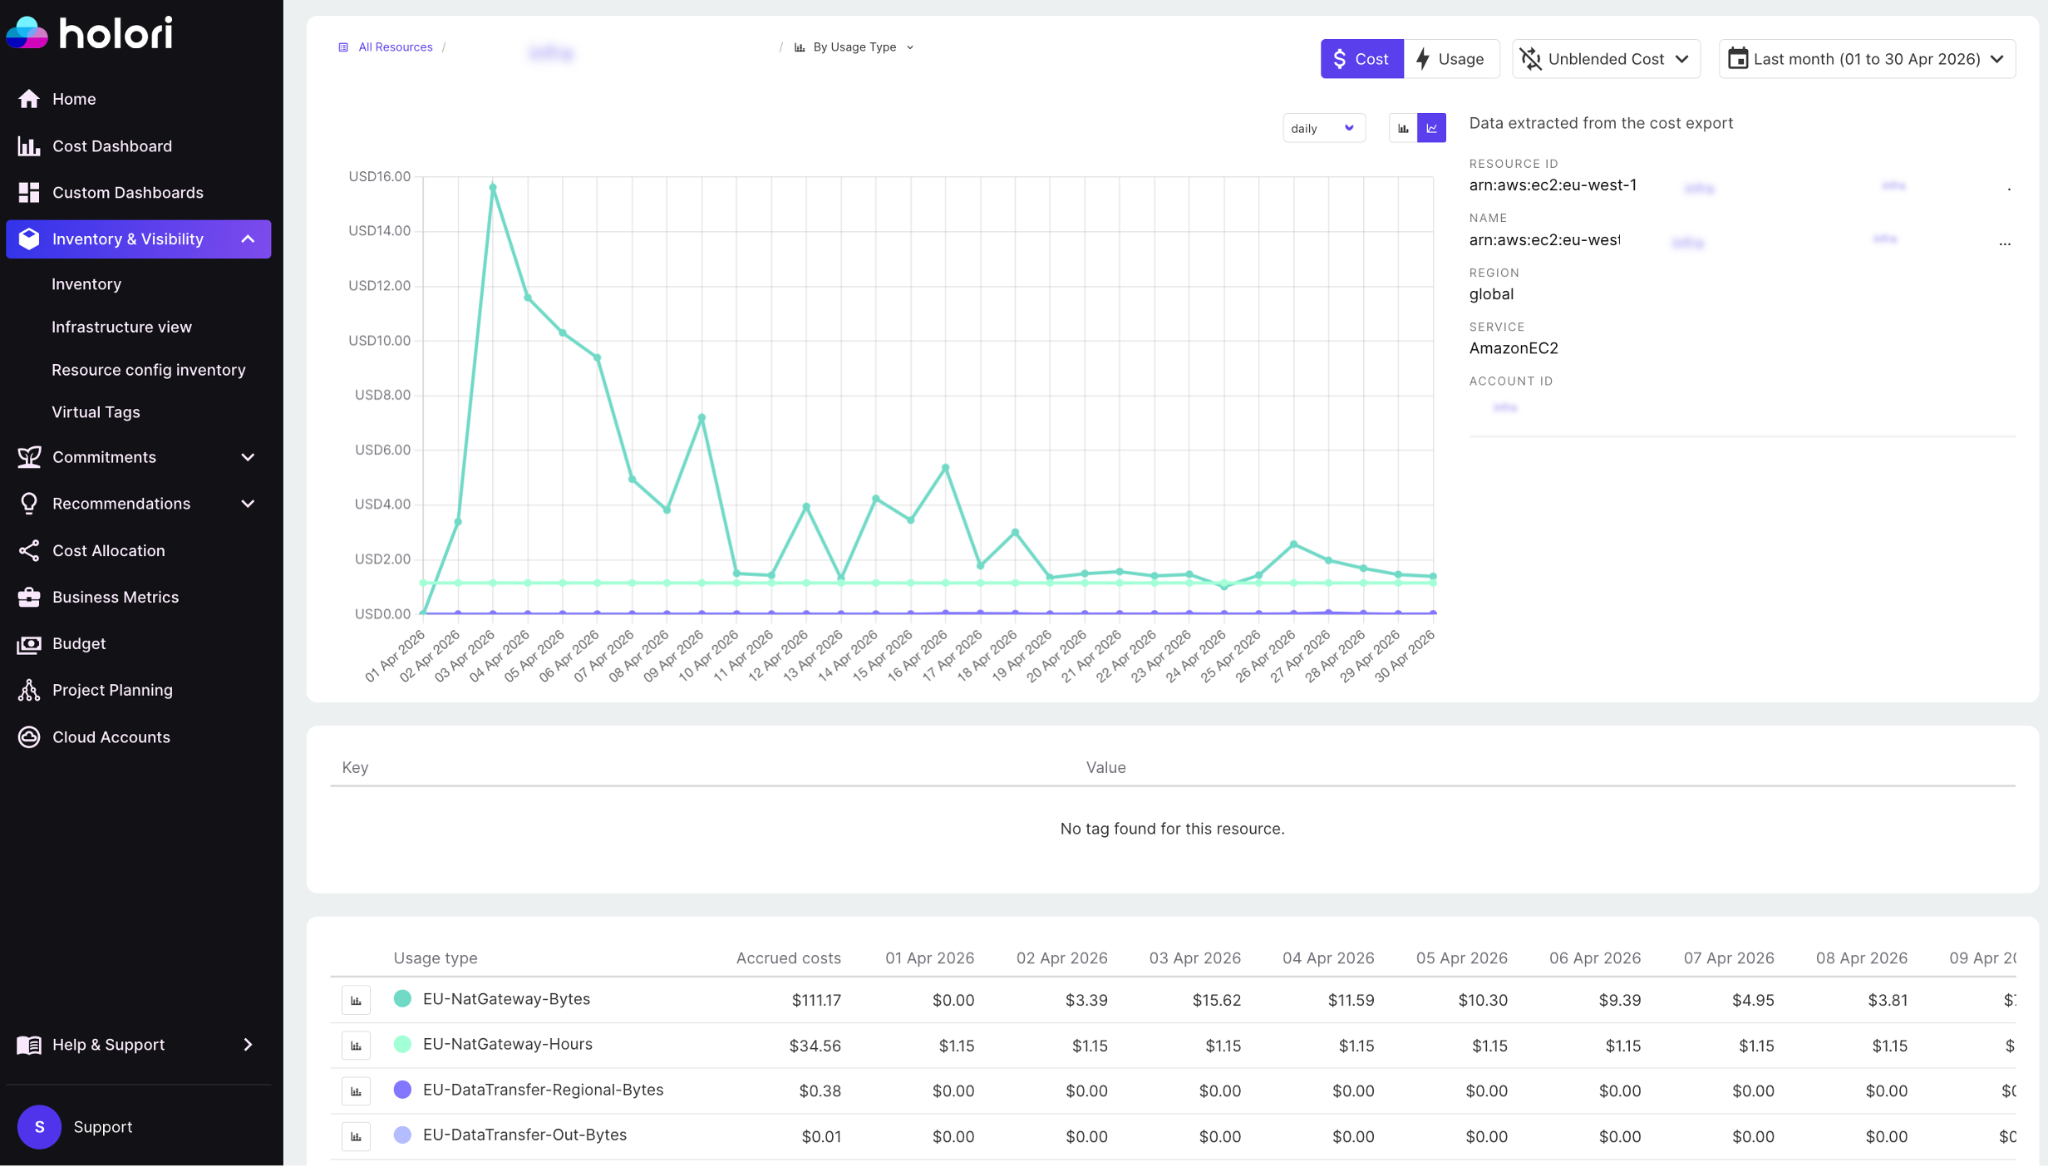
At the instance level, you need the daily cost of each running instance, tied to its specific usage components. Not just a total, but a breakdown that tells you: this instance cost $4.20 yesterday, of which $3.80 was compute hours, $0.25 was EBS volume, and $0.15 was data transfer. When that number changes day over day, you want to know which component changed — not just that the total moved.
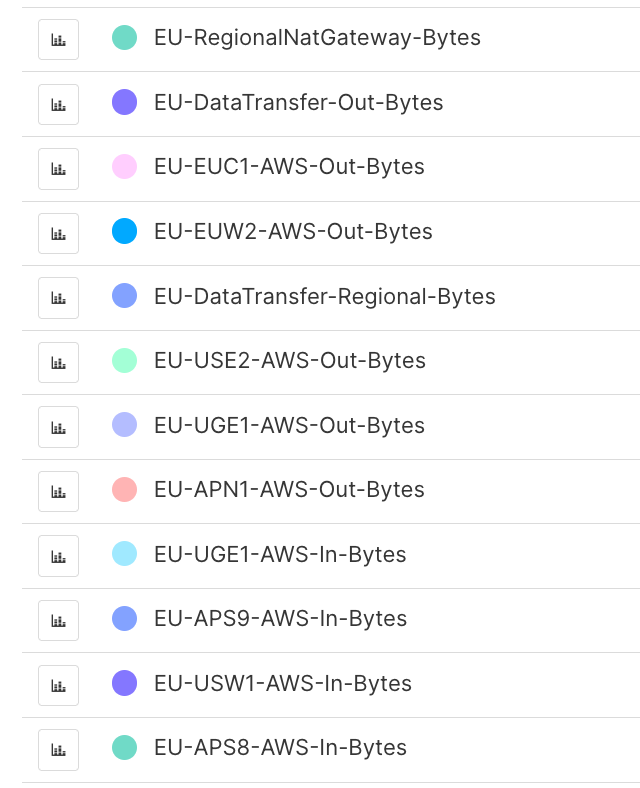
At the usage level, you need costs expressed in non-monetary units. How many hours did this instance run? Then, how many GB did it transfer? How many IOPS did it consume? These numbers let you validate whether cost increases reflect actual usage growth or a pricing change. They also let engineers understand cost in terms they already work with.
Over time, you need at least 24–36 months of daily granularity. This matters for detecting cost regressions after deployments, understanding monthly seasonality, evaluating the impact of Reserved Instance purchases, and building accurate forecasts.
How Holori Gives You Real EC2 Cost Granularity
A Practical Workflow for EC2 Cost Analysis
Here is how a cloud finance or DevOps team can use detailed EC2 cost data systematically.
Step 1: Establish a baseline.
Start by pulling the last 30 days of daily costs per instance. Identify the top 10 most expensive instances. For each one, get the component-level breakdown: compute, storage, network. This tells you where to focus first.
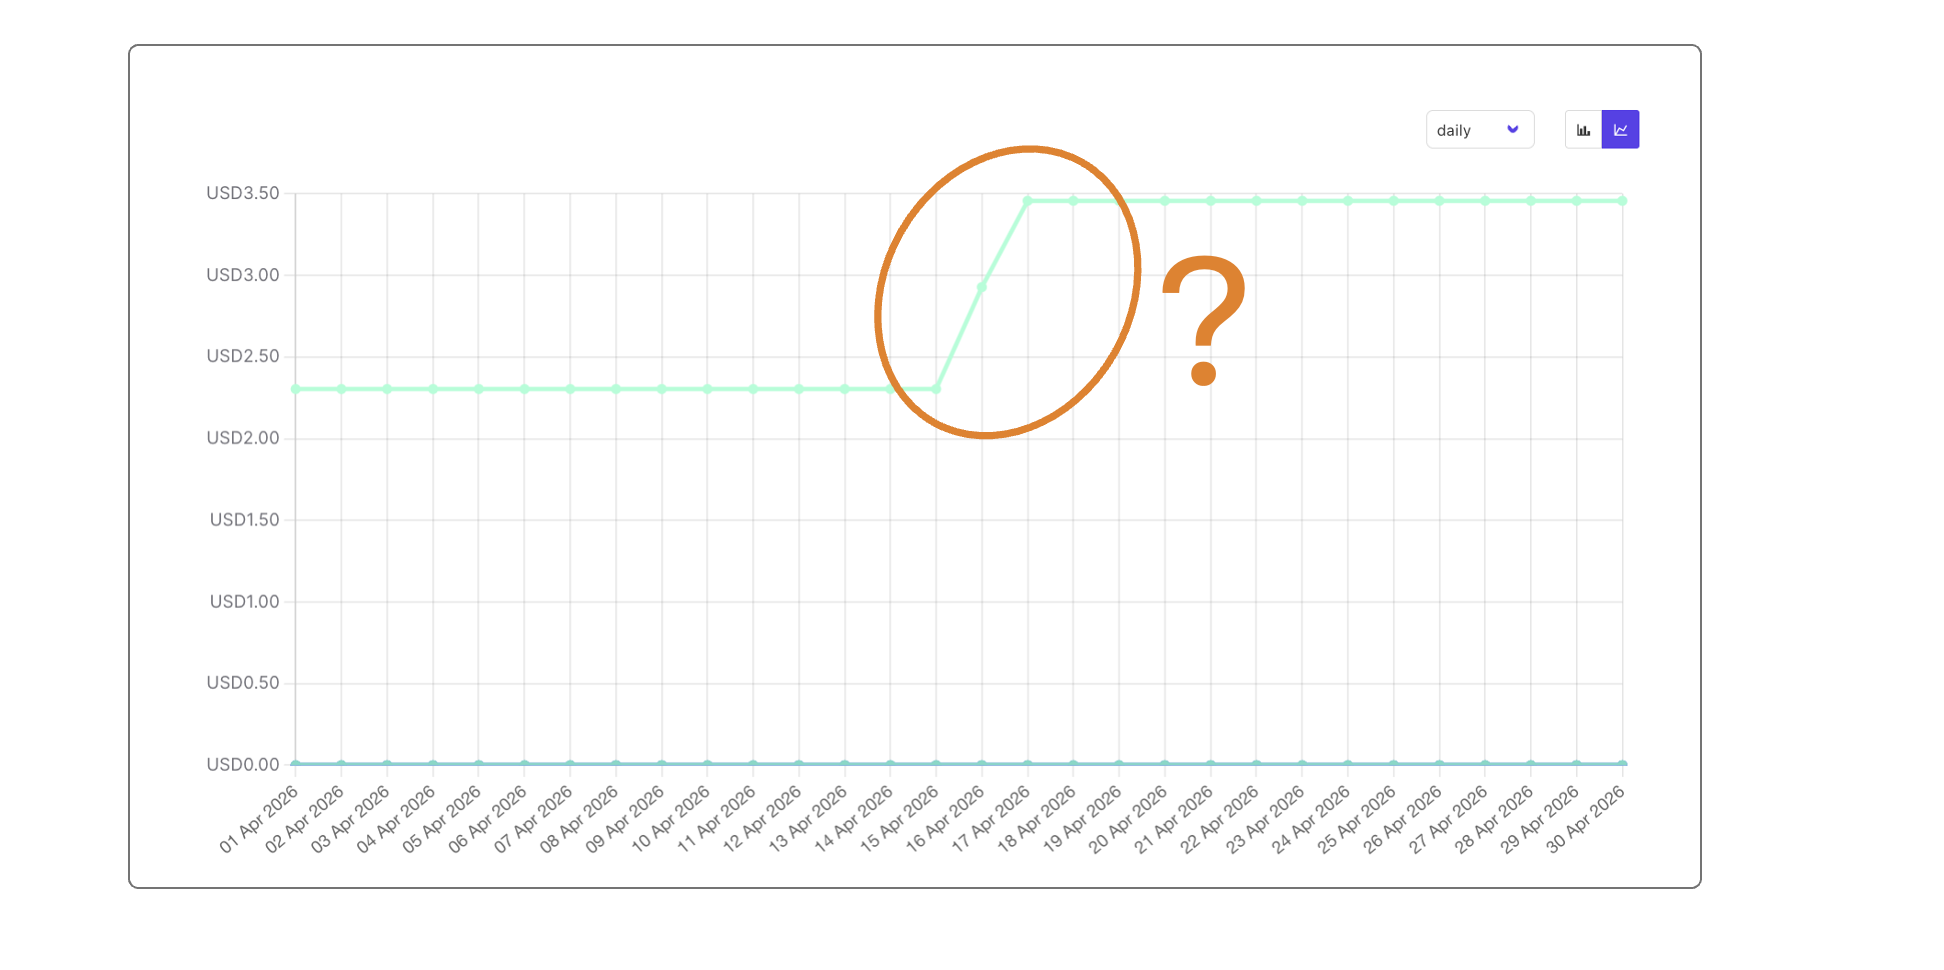
Step 2: Look for anomalies in the daily trend.
For your top spenders, review the daily cost over the past 90 days. A flat line is normal. A sudden step-up that persists suggests a configuration change. For example an EBS volume type change, an instance resize, or a shift from Reserved to On-Demand. A spike followed by a return to normal suggests a burst event or a misconfiguration that was corrected.
Step 3: Audit idle or stopped instances with active EBS.
Using usage-unit data, identify instances that ran zero or near-zero hours in the last 30 days but still show storage charges. These are stopped instances with attached volumes. They are paying for storage without providing value.
Step 4: Check data transfer costs per instance.
Data transfer charges are often invisible until they accumulate. By looking at per-instance transfer costs broken down to the daily level, you can identify instances that consistently generate high outbound traffic and investigate whether that traffic is expected.
Step 5: Compare cost trends over 12+ months.
For long-running production instances, compare the average daily cost this quarter versus the same quarter last year. Cost variations, where spend drifts upward 5–10% per month without a clear cause, is real and often goes unnoticed without a long enough history.
Step 6: Validate Reserved Instance coverage.
If you have Reserved Instances or Savings Plans, check whether your highest-spend instances are covered. Holori shows the purchase type applied to each instance’s billing, so you can quickly identify On-Demand instances that have equivalent Reserved Instance capacity available.
Common EC2 Cost Patterns and What They Mean
Understanding patterns in your EC2 cost data helps you act faster when something changes.
A sudden cost increase on a single instance usually means one of three things: the instance was resized to a larger type, an additional EBS volume was attached, or it moved from a Reserved Instance to On-Demand billing (which can happen when a reservation expires). Component-level breakdown tells you which.
A gradual cost increase across many instances often points to data transfer growth. As workloads mature and more services communicate with each other, cross-AZ or internet-bound traffic tends to grow. Usage-unit data in GB makes this trend visible before it becomes a major cost driver.
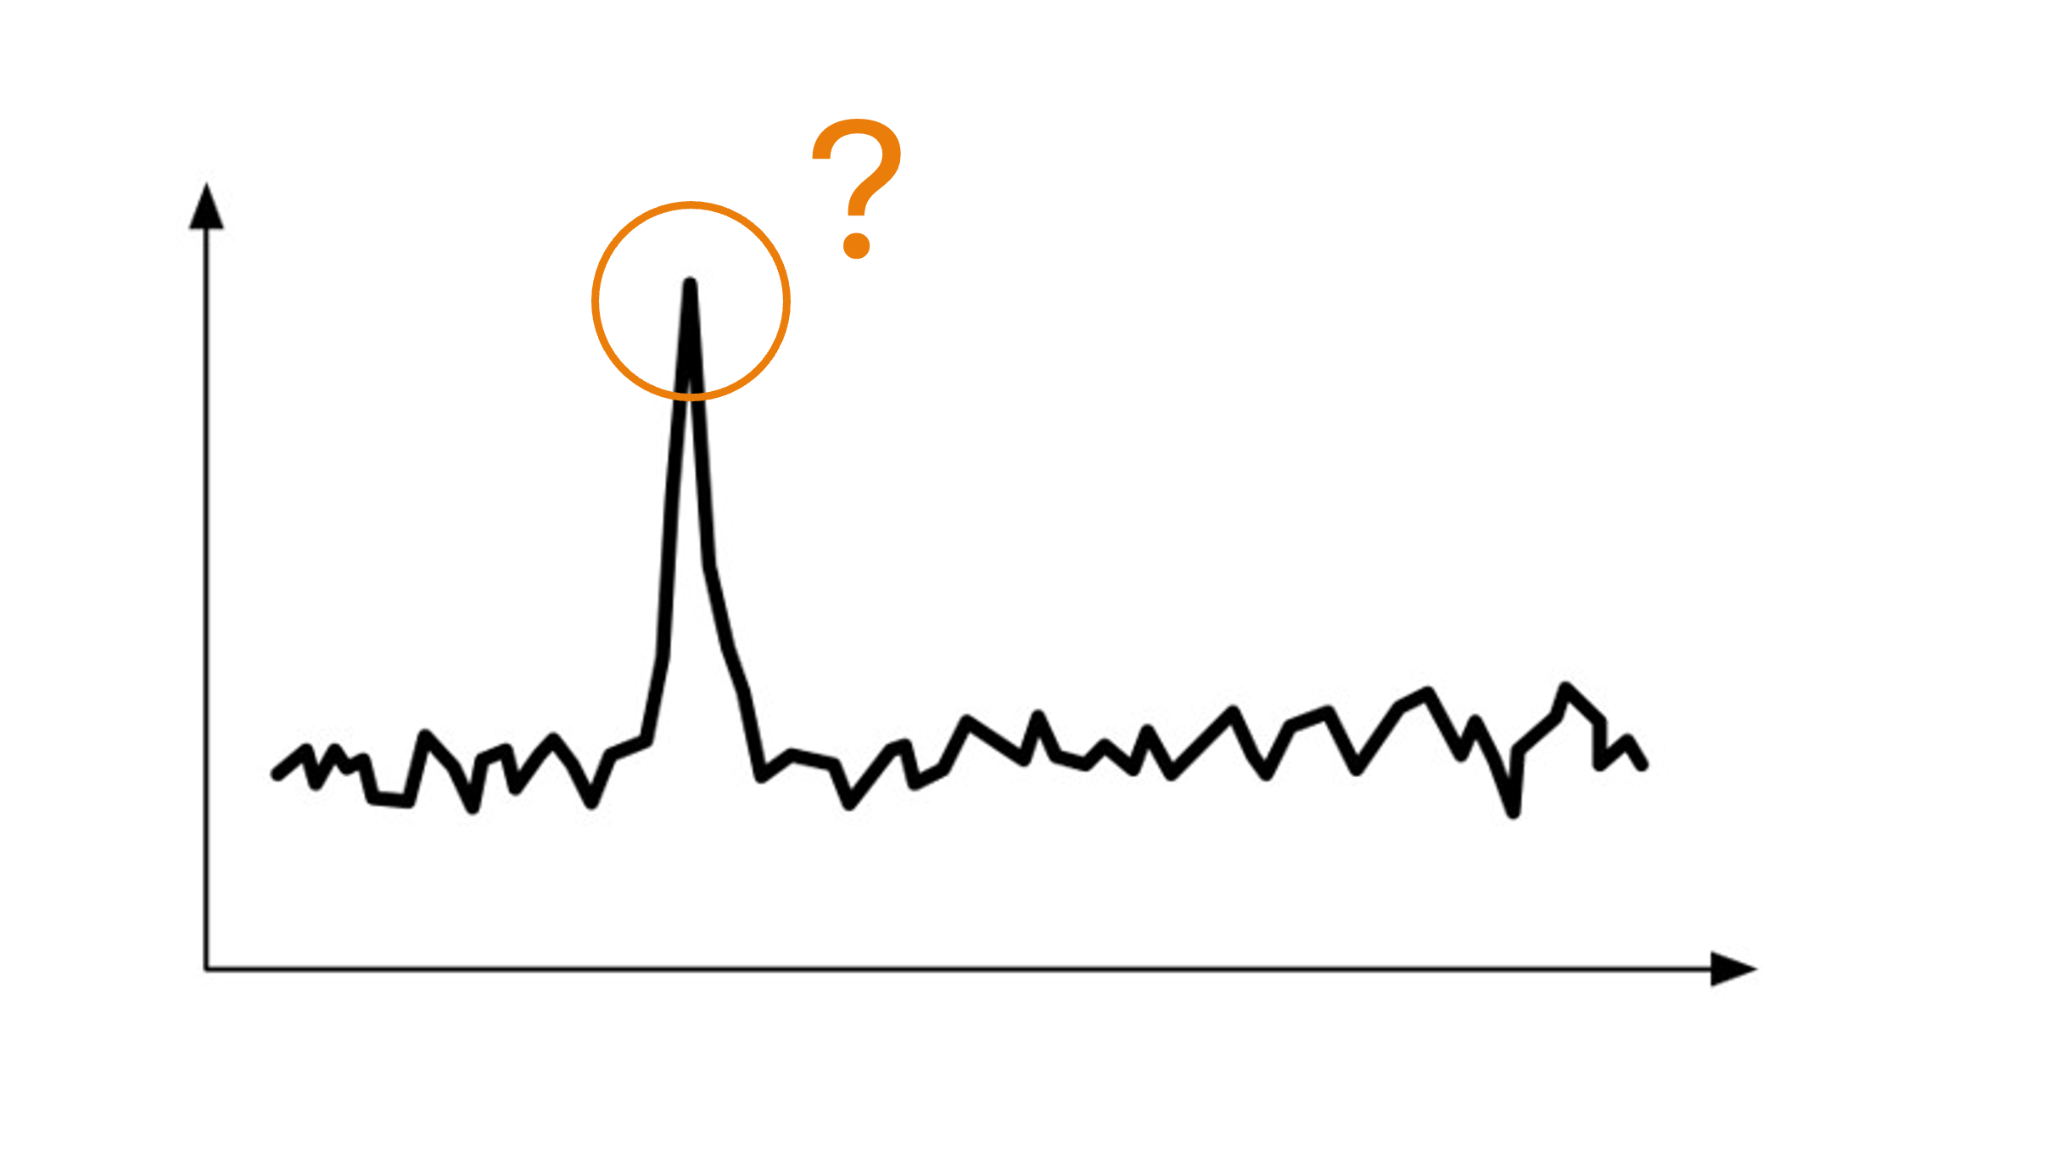
A cost spike on a specific day that then returns to baseline usually corresponds to a batch job, a load test, or a backup operation that triggered unusual compute or storage activity. Daily granularity is essential to catch these — monthly aggregates would smooth them out entirely.
Storage costs that grow independent of compute indicate volume accumulation. Teams that snapshot frequently but never delete old snapshots, or that attach large volumes for temporary work and forget to detach them, generate storage costs that compound over time.
Right-Sizing EC2 Instances Using Cost and Configuration Data Together
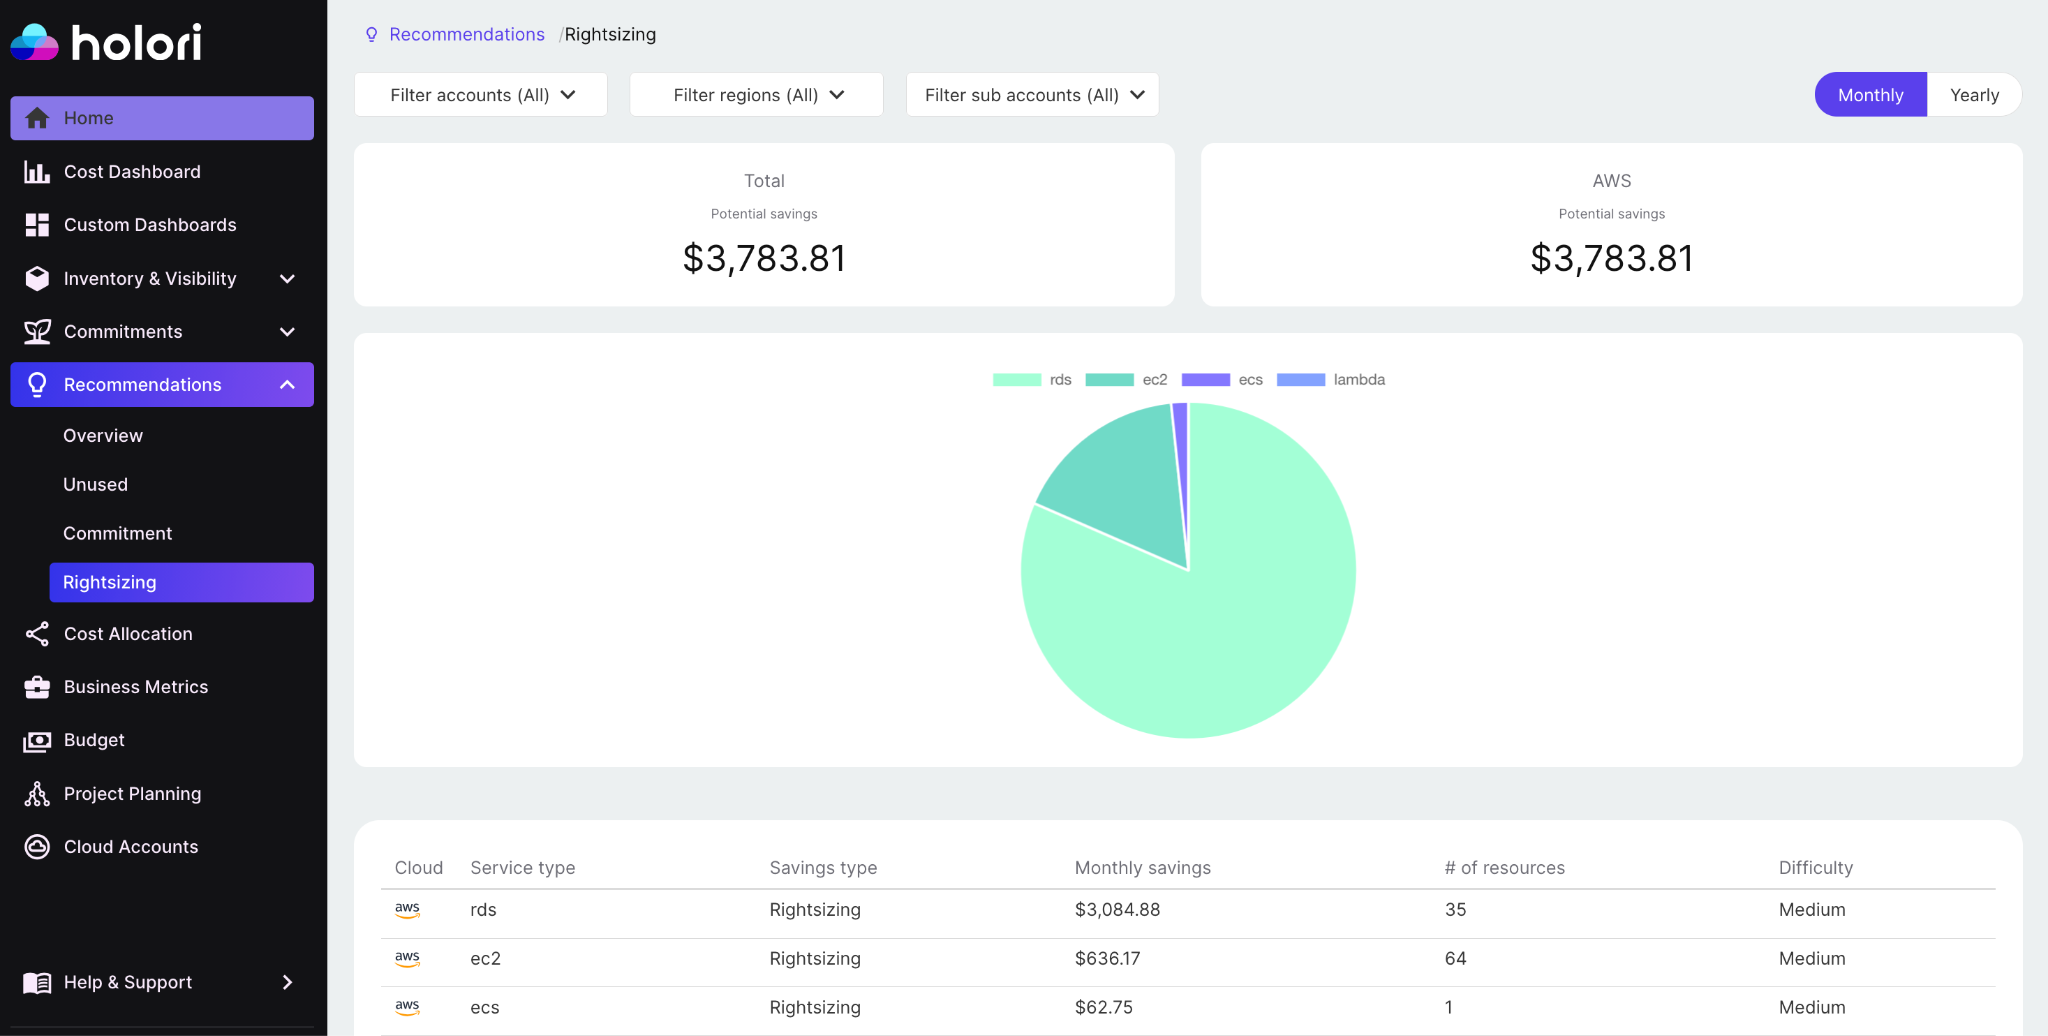
Right-sizing is one of the highest-impact cost optimization actions available, but it requires both cost data and technical configuration data to do correctly.
The cost alone does not tell you whether an instance is oversized. An expensive instance might be expensive because it is genuinely doing a lot of work. A cheap instance might be oversized relative to its actual utilization. You need the configuration : instance type, CPU, memory, alongside utilization metrics and cost trend data to make a sound decision. Holori provides alternative recommendations for your instances.
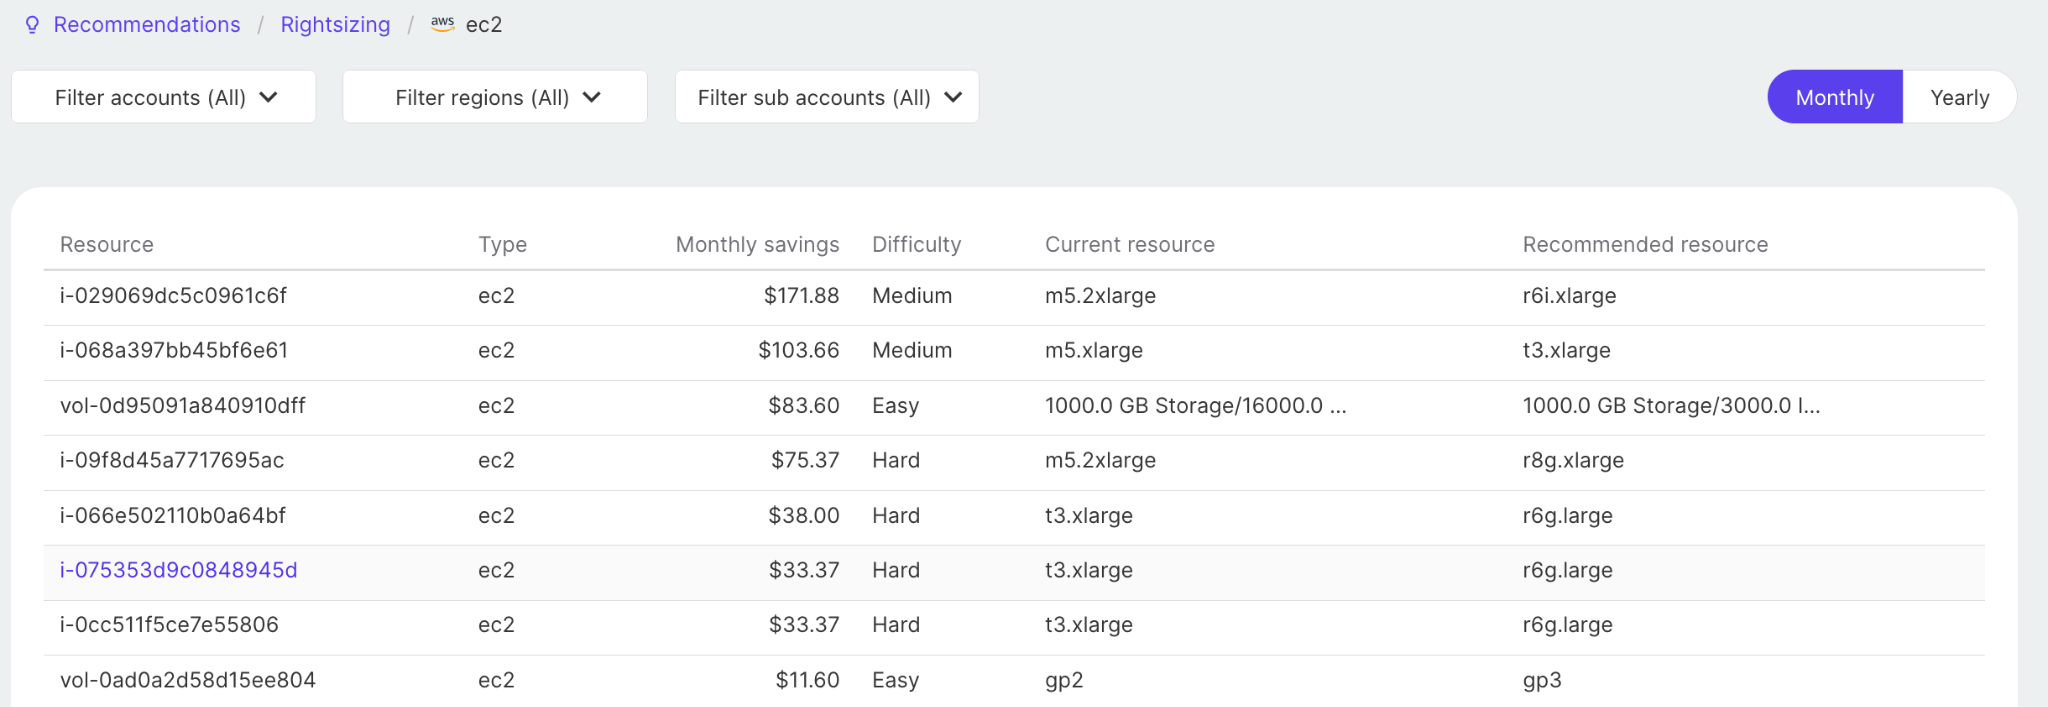
Holori surfaces the full technical configuration of each instance alongside its cost breakdown. This means you can, in a single view, see that an instance is a r5.4xlarge with 128 GB of RAM, has been running 720 hours per month, has averaged $620/month over the last 12 months, and that its compute component accounts for $590 of that. You can then compare that against utilization data to decide whether a move to an r5.2xlarge is warranted.
This combined view eliminates the need to cross-reference Cost Explorer, CloudWatch, and the EC2 console simultaneously. This process is time-consuming and error-prone at scale.
Tagging Strategy and Its Impact on Cost Breakdown Quality
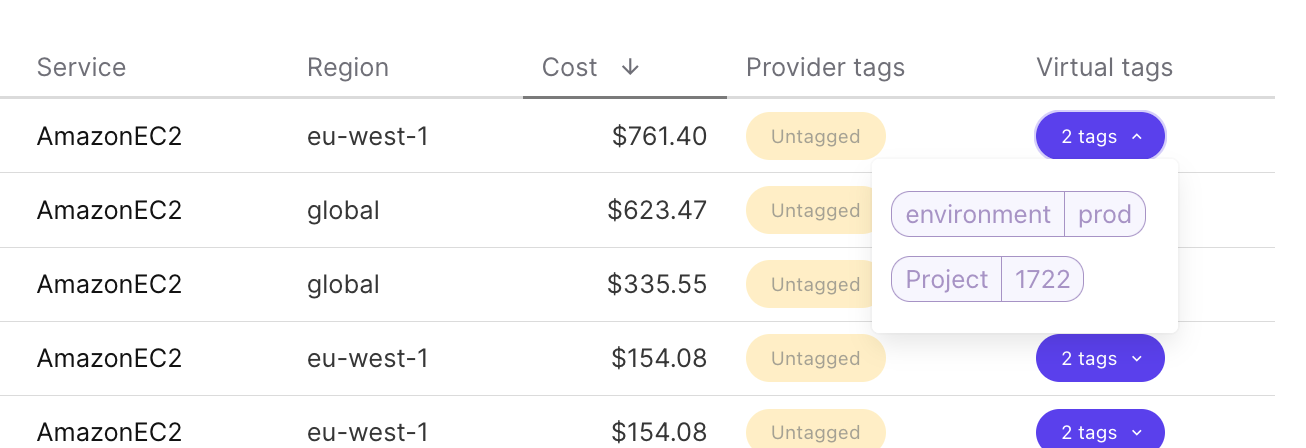
Image: Virtual tags in Holori App
The quality of your EC2 cost breakdown depends heavily on your tagging strategy. AWS allocates costs to resources based on their tags, and untagged resources create gaps in any analysis.
At a minimum, each EC2 instance should carry tags for environment (production, staging, development), team or owner, project or application, and cost center. These four dimensions allow you to slice your EC2 costs by business unit, by application, and by deployment environment.
Without consistent tagging, you will see a large “unallocated” bucket in any cost breakdown, which makes it impossible to attribute costs accurately or hold teams accountable for their spend.
Holori can highlight untagged instances in your inventory, so you can identify coverage gaps and enforce tagging standards before they become a reporting problem. Moreover, if your resources are not, or insufficiently, tagged, you can create your own Virtual Tags directly in Holori. This helps you keep tracking of each resource.
EC2 Cost Reporting for FinOps Teams
For teams running a FinOps practice, the ability to report EC2 costs accurately to engineering leads and finance stakeholders is essential. This requires data that is precise, consistent, and available at the right cadence.
Daily granularity at the instance level enables weekly cost reviews. Teams can compare this week versus last week, and instance-level data means you can point to specific resources rather than discussing abstract totals.
36-month history enables quarter-over-quarter and year-over-year comparisons. Finance teams can plan budgets with confidence when they have a long baseline. Engineering teams can measure the impact of optimization initiatives over time rather than guessing.
Usage-unit data enables conversations between engineering and finance that are grounded in operational reality. When a finance lead asks why EC2 costs went up 15% last month, the answer “data transfer increased by 400 TB, here is which instances drove it” is far more actionable than “costs went up.”
Holori is designed to serve both audiences from the same underlying data. The technical team that needs per-instance detail and the finance team that needs roll-ups and trends.
Conclusion
AWS EC2 cost management is not a one-time exercise. It requires ongoing visibility into costs at the instance and component level, a long enough history to spot trends, and the ability to connect cost data to the technical configuration of each resource.
The gap between what AWS provides natively and what teams actually need for serious cost analysis is significant. Filling that gap requires purpose-built tooling that ingests CUR data, maps it to individual instances, preserves 36 months of daily history, and exposes both dollar amounts and native usage units.
Holori was built to close that gap. If your team manages a meaningful EC2 footprint and wants to move from reactive cost reviews to proactive cost management, the place to start is with granular, reliable data, and that is what Holori provides.
Ready to get a detailed breakdown of your EC2 costs? Start a free trial with Holori and connect your AWS account in minutes.