Cloud cost visibility is no longer a nice-to-have for modern engineering and finance teams. It is a critical capability. As cloud environments grow more complex, organizations struggle to understand who spends what, where, and why.
Without clear cloud spend visibility, budgets spiral out of control and accountability disappears. Teams point fingers at each other. Finance teams work off outdated spreadsheets. Engineers have no idea their new service is burning thousands of dollars per month.
This guide walks you through 10 actionable tips to improve cloud cost visibility across AWS, Google Cloud (GCP), Microsoft Azure and others. Whether you are just getting started with cost allocation or looking to refine your showback chargeback model, these tips will help you build a culture of cost accountability.
Tip 1: Define a Consistent Tagging Strategy Across All Cloud Providers
The foundation of cloud cost visibility is tagging. Without a consistent and enforced tagging strategy, cost data quickly becomes unmanageable. Tags allow you to attribute every resource and every dollar to a team, project, environment, or cost center.
Why Tags Matter
AWS, GCP, and Azure all support resource tagging, but they each implement it differently. AWS uses key-value tags on most services. GCP uses labels. Azure uses tags at the resource and resource group level. Aligning these across clouds is not trivial, but it is essential.
Start by defining a mandatory set of tag keys that apply to every resource: environment (production, staging, dev), team or department, project or product name, and cost center. Make these tags mandatory through cloud policies and governance rules. In AWS, use AWS Config rules or Service Control Policies. For GCP, enforce labels with Organization Policies. In Azure, use Azure Policy to deny untagged resource creation.
Handling Tag Gaps
Even with strict policies, some resources will inevitably be untagged. Virtual tags offer a powerful workaround. A platform like Holori lets you create virtual tags that group resources retroactively based on naming conventions, account structure, or other metadata, without having to modify the original cloud resources. This ensures that untagged spending does not fall into a black hole.
Tip 2: Centralize Cloud Cost Data in a Single Platform
Cloud spend visibility becomes exponentially harder when cost data lives in silos. AWS Cost Explorer shows you AWS costs. GCP Billing shows you GCP costs. Azure Cost Management shows you Azure costs. But none of them give you the full picture.
Organizations running workloads across multiple cloud providers need a centralized view. This is especially true for platform engineering teams, FinOps practitioners, and CFOs who need to understand total cloud expenditure at a glance.
The Problem with Native Billing Consoles
Native billing consoles are optimized for their own cloud. They do not speak the same language when it comes to reporting structures, cost categories, or allocation logic. Comparing a GCP billing export with an Azure Cost Management report manually is error-prone and time-consuming.
A multi-cloud cost management platform solves this. Holori connects to AWS, GCP, and Azure to consolidate billing data in one unified dashboard. Teams get a single source of truth for cloud cost visibility, regardless of how many providers they use.
Tip 3: Implement a Clear Cost Allocation Model
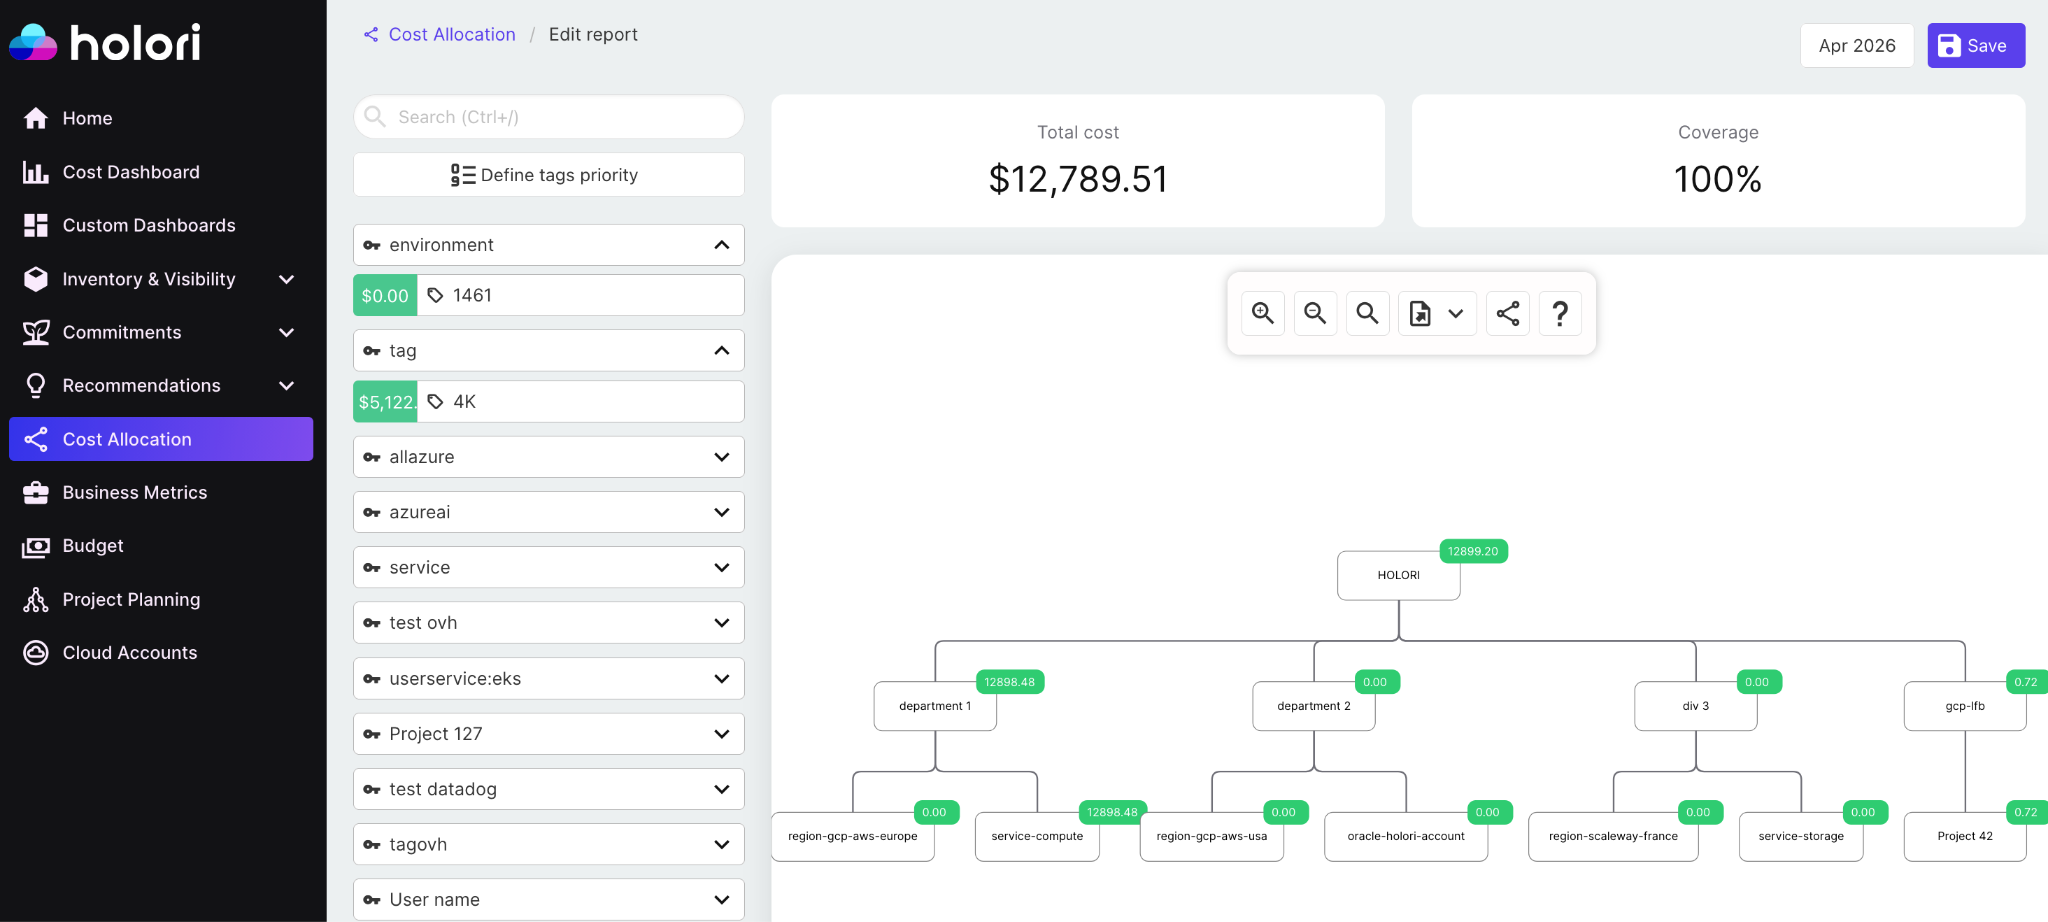
Cost allocation is the process of distributing cloud costs to the teams, products, or business units that generate them. Without it, the cloud bill is just one giant number that nobody owns.
There are two main approaches to cost allocation: direct allocation and shared cost allocation. Direct allocation maps costs to teams based on tags, accounts, or subscriptions. Shared cost allocation distributes common infrastructure costs, like networking, security tooling, or shared Kubernetes clusters, across multiple consumers using a chosen distribution method.
Choosing the Right Allocation Method
For direct costs, tag-based allocation is the most granular approach. For shared services, you can use proportional allocation based on usage, fixed splits agreed upon by teams, or even a flat fee per consuming team.
The right model depends on your organization’s culture and maturity level. Start simple. A basic cost allocation model that runs consistently is far more valuable than a perfect model that never gets fully implemented.
Account and Subscription Segmentation
One of the most effective cost allocation techniques is structural segmentation. In AWS, use separate accounts per team or environment. For GCP, use separate projects. In Azure, use subscriptions or resource groups. Structural separation means costs are allocated by default, without relying entirely on tagging compliance.
Tip 4: Adopt Showback and Chargeback Reporting
Once you have cost allocation in place, the next step is operationalizing it through showback chargeback reporting. These two models serve different purposes and suit different organizational maturity levels.
Showback vs. Chargeback: What Is the Difference?
Showback means sending teams a report of their cloud costs for informational purposes. There is no financial transfer. Teams see what they spend, which drives awareness and encourages responsible behavior. Chargeback goes further. Costs are financially transferred to the business unit or team. Each team pays for what they consume.
Showback is the right starting point for most organizations. It builds awareness without creating organizational friction. Once teams understand and trust the data, you can move to chargeback.
Building Effective Showback Reports
A good showback report is timely, accurate, and actionable. It should show current month spend, trends over time, and comparisons against budget. It should highlight anomalies and flag unexpected increases.
Holori generates automated showback and chargeback reports that can be scoped per team, per project, or per cost center. Reports pull live data from AWS, GCP, and Azure so finance teams always work with accurate figures, not week-old exports.
Tip 5: Set Budgets and Alerts at the Team Level

Cloud cost visibility is reactive if teams only discover overspending at the end of the month. Budgets and real-time alerts shift the dynamic. They give teams early warning signals that let them course-correct before costs escalate.
Native Budget Tools Across Cloud Providers
AWS Budgets allows you to set cost and usage thresholds with email or SNS alerts. GCP Budget Alerts can notify via email or Pub/Sub. Azure Cost Management supports budgets at subscription, resource group, and management group levels.
These native tools are useful, but they operate in isolation. A team running workloads across AWS and GCP would need separate budgets in each console. There is no single view of budget versus actuals across clouds.
Cross-Cloud Budget Management
Centralizing budgets alongside your cost allocation model makes enforcement much easier. Platforms like Holori let you define budgets at the team or project level that span multiple cloud accounts and providers. Alerts fire in one place, and teams get a unified view of their spending against target.
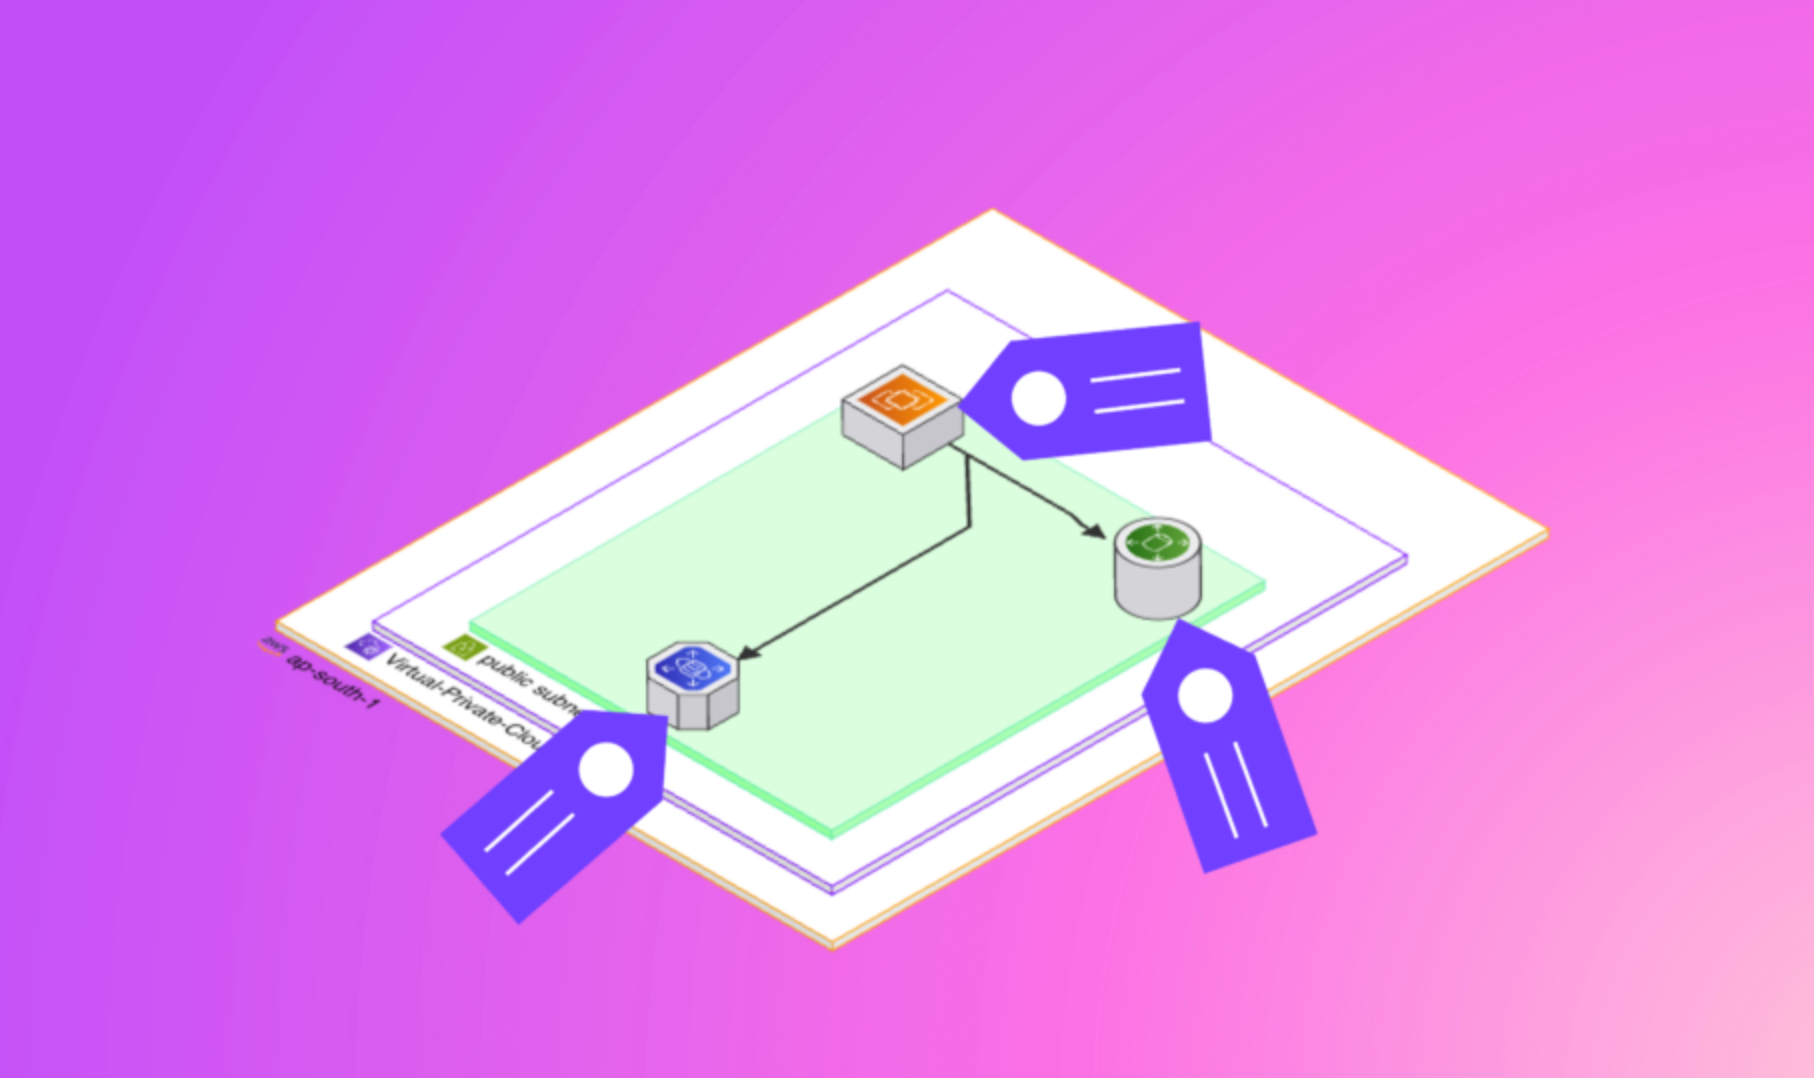
Tip 6: Map Cloud Spending to Business Units with a diagram View
One of the underused approaches to cloud cost visibility is mapping infrastructure visually to business ownership. Most engineers understand what their cloud architecture looks like. Most finance teams do not. Bridging this gap creates better conversations and faster decisions.
Why Topology Matters for Cost Ownership
When a team can see their cloud infrastrcuture alongside cost data, attribution becomes intuitive. A microservice-based application with ten services becomes much easier to analyze when you can see which services are the biggest spenders and which ones have changed recently.
Holori’s builds cloud infrastructure diagram. Engineers can navigate from a resource directly to its cost history. Finance teams can understand what how an architecture translates in costs. This bridge between technical and financial visibility is a key differentiator for cloud cost visibility at scale.
Connecting Architecture to Cost Accountability
Topology views also help identify orphaned or forgotten resources. A load balancer pointing to a decommissioned service. An idle database no longer connected to any application. These architectural ghosts are invisible in a billing CSV but immediately obvious in a topology map.
Tip 7: Establish a Regular Cloud Cost Review Cadence
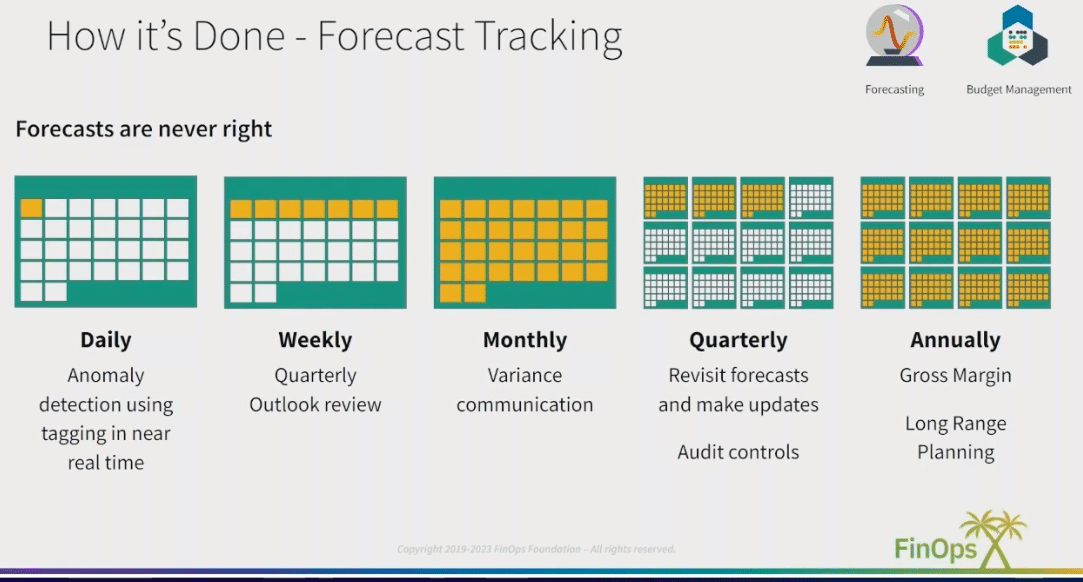
Cloud cost visibility is not a one-time setup. It requires ongoing attention. Many organizations invest in tooling but skip the governance processes that make cost awareness stick.
What a Good Cost Review Looks Like
A monthly or bi-weekly cloud cost review meeting brings together engineering leads, product managers, and finance. The agenda is simple: what did we spend this period, how does it compare to budget, what drove the biggest changes, and what actions are we taking.
This meeting should not be a blame session. It should be a problem-solving session. The goal is to understand cost drivers, validate allocation accuracy, and prioritize optimization opportunities. Teams that hold regular cost reviews consistently outperform those that review costs only when there is a budget crisis.
Making Reviews Actionable
Every review should end with clear owners and deadlines for optimization actions. Track these across reviews. Over time, the cadence builds institutional knowledge about what drives cloud costs and how to control them. Combine this with your showback reports to create a feedback loop that reinforces cost-conscious behavior at the team level.
Tip 8: Use Granular Cost Allocation for Shared Infrastructure
Shared infrastructure is one of the biggest challenges for cost allocation. A Kubernetes cluster running workloads for five teams, a transit gateway routing traffic for multiple accounts, or a shared logging pipeline can be difficult to attribute accurately.
Approaches to Shared Cost Allocation
There are several approaches to handling shared costs. The simplest is to pick a fixed split agreed upon by all consuming teams. More sophisticated approaches use actual usage metrics to allocate proportionally. For a shared Kubernetes cluster, you might allocate costs based on CPU and memory requests per namespace.
AWS offers Cost Categories and split cost allocation for EKS. GCP provides billing data exports you can query with BigQuery to calculate proportional shares. Azure supports cost allocation rules in Cost Management.
Going Beyond Native Tools
For complex environments, native tools often fall short. Holori allows you to define custom allocation rules that span multiple cloud accounts and providers. You can build allocation logic that maps to your organizational structure, not the structure that each cloud provider happens to offer.
Tip 9: Track Cost Per Feature, Service, or Customer
Advanced cloud cost visibility goes beyond tracking costs per team. Leading FinOps practitioners track costs at the product level: cost per feature, cost per service, or even cost per customer.
Why Unit Economics Matter
Unit cost metrics connect cloud spending to business outcomes. If you know your cloud infrastructure costs $0.04 per user session, you can model how costs scale as you grow. If a new feature launches and cost per session jumps to $0.07, you know immediately that something needs optimization.
This level of visibility is what separates reactive cost management from strategic cost management. It allows engineering teams to make architecture decisions with full awareness of cost implications.
How to Build Unit Cost Metrics
Start by identifying the business metric that best represents your product’s value: monthly active users, API calls, processed transactions, or any other meaningful unit. Then, divide your relevant cloud costs by that metric each month. Even a rough estimate is more useful than no unit cost data at all.
Pairing this analysis with your cost allocation and showback chargeback data in a platform like Holori allows you to slice unit costs by team, environment, or cloud provider. This gives leadership a richer understanding of efficiency trends over time.
Tip 10: Integrate Cloud Cost Visibility into Your Engineering Workflow
FinOps is at the crossroads of Business and Technology strategies. This is the core of the FinOps framework as described below by the FinOps foundation.
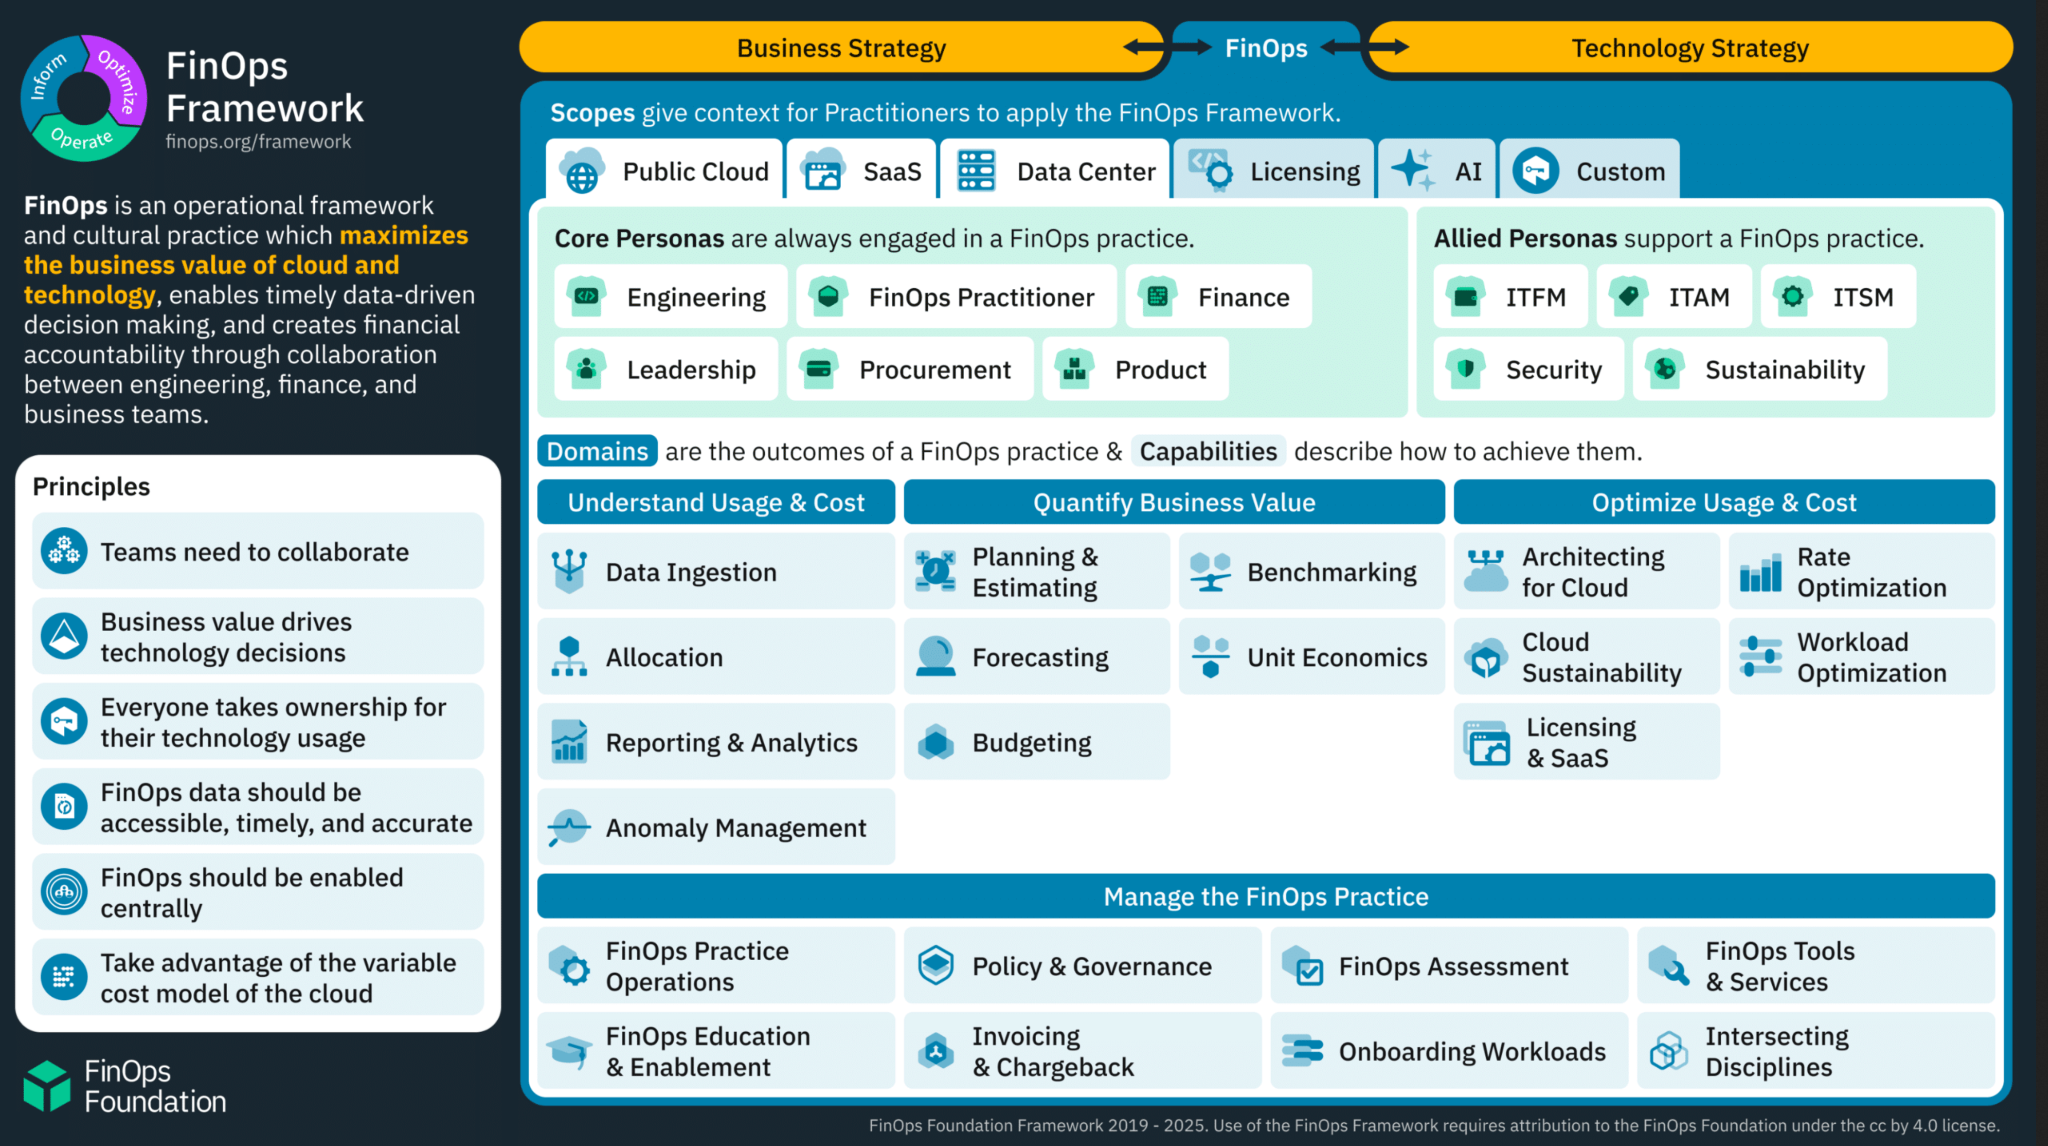
The most sustainable way to improve cloud cost visibility is to make cost awareness a natural part of how engineers work. Cost should not be something they only hear about from finance once a month.
Shifting Left on Cost
Cost awareness should start in the design phase. When engineers propose a new architecture, cost estimation should be part of the review. Use AWS Pricing Calculator, GCP Pricing Calculator, or Azure Pricing Calculator to estimate costs before deployment. Set expectations about budget targets at the project kickoff stage.
During development, use infrastructure-as-code tools like Terraform or Pulumi with cost estimation integrations. Tools like Infracost can estimate the cost impact of a Terraform change before it is merged. This shifts cost awareness left, to a point where it is cheap to act.
Connecting Cost to CI/CD Pipelines
Some mature teams embed cost checks into their CI/CD pipelines. A pull request that would increase monthly costs by more than a defined threshold requires a cost review before merging. This creates a culture where cost is treated like any other quality signal, not an afterthought.
As your infrastructure grows, a platform that provides programmatic access to cost data allows teams to embed cost signals directly into internal developer portals, dashboards, and deployment workflows. Engineers get cloud spend visibility in the tools they already use, without switching context.
How Holori Can Help You Improve Cloud Cost Visibility Across Your Team
Improving cloud cost visibility requires more than good intentions. It requires a platform that connects billing data, organizational structure, and infrastructure context in one place. That is exactly what Holori is built to do.
A Unified View Across AWS, GCP, and Azure
Holori connects to all three major cloud providers and consolidates your billing data into a single dashboard. There is no more switching between AWS Cost Explorer, GCP Billing, and Azure Cost Management to piece together a picture of your total cloud spend visibility. Everything appears in one place, updated automatically.
This unified view is the starting point for every other cost visibility practice. You cannot allocate what you cannot see. You cannot govern what is spread across three disconnected tools. Holori eliminates that fragmentation from day one.

Virtual Tags for Instant Cost Allocation
One of the most powerful features Holori offers is virtual tagging. Not every resource in your environment is perfectly tagged. Legacy workloads, third-party services, and managed resources often lack proper labels. Holori’s virtual tags let you group resources retroactively based on naming conventions, account structure, or any custom rule you define.
This means your cost allocation model does not have to wait for a perfect tagging rollout. You can start building meaningful cost breakdowns today, even with an imperfect tag coverage across AWS, GCP, and Azure.
Showback and Chargeback Reports Built for Teams
Holori generates automated showback chargeback reports scoped to any dimension you care about: team, environment, project, cost center, or cloud provider. Reports pull live data so finance teams always work from accurate figures.
Each report is designed to be readable by non-technical stakeholders. A product manager or business unit lead does not need to understand cloud billing structures to review their monthly spend report. Holori translates raw billing data into business-readable summaries that drive real conversations about cost ownership.
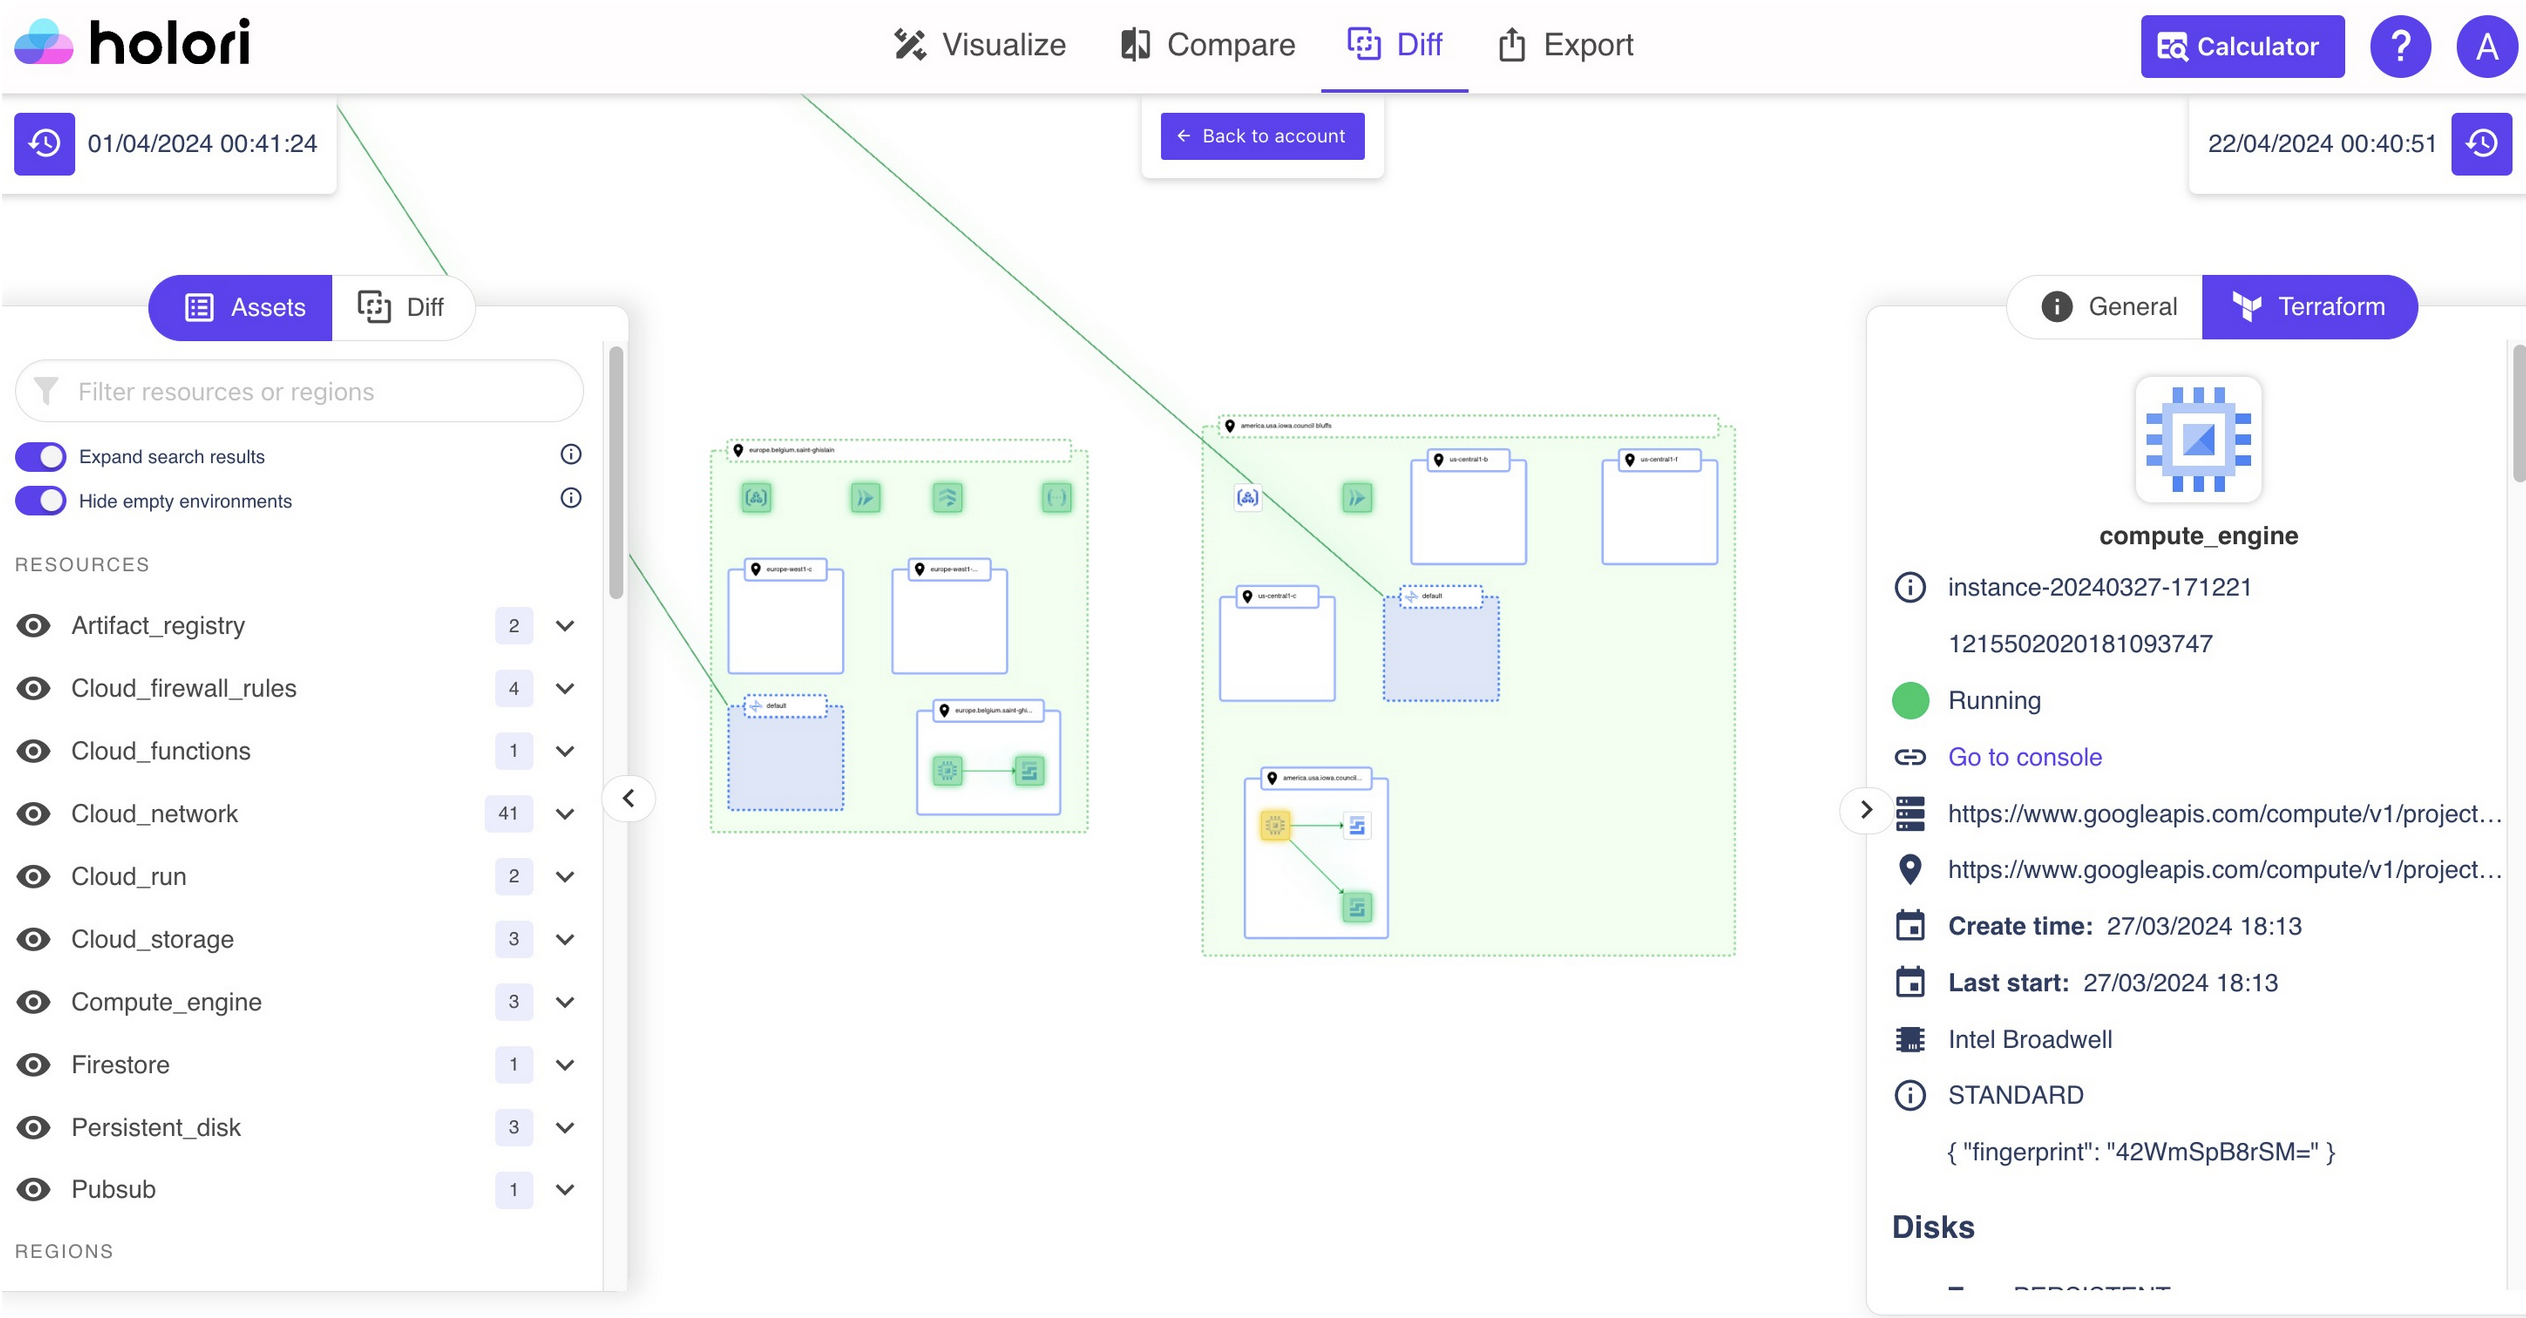
Topology View: See Your Architecture and Its Cost Together
Most cost tools show you numbers. Holori also shows you what those numbers represent. The topology view maps your cloud infrastructure visually. Engineers can navigate from a service to its cost history. Architects can identify expensive patterns. Finance teams can understand what they are paying for.
This combination of architectural context and cost data is particularly useful during architecture reviews, incident postmortems, or any conversation where the team needs to understand the cost impact of a technical decision.
Multi-Cloud Budgets and Alerts in One Place
Holori lets you define budgets that span multiple cloud accounts and providers. Instead of managing separate budget rules in AWS Budgets, GCP Budget Alerts, and Azure Cost Management, you set your targets once in Holori and receive consolidated alerts when thresholds are approached or exceeded.
This is especially useful for platform teams managing shared infrastructure across clouds. A single budget covering production workloads across AWS and GCP, with a unified alert, is far easier to govern than two separate budget policies in two separate consoles.
Only the hyperscalers? Not really, Holori is also compatible with many more cloud, AI and service providers.
Getting Started with Holori
Getting started with Holori is designed to be fast. Connect your cloud accounts, define your organizational structure, and begin seeing consolidated cost data within minutes. From there, you can layer in virtual tags, configure showback reports, and set up team-level budgets at your own pace.
Whether you are a startup trying to understand your first cloud bill or an enterprise looking to scale cloud cost visibility across dozens of teams, Holori adapts to your needs. Visit holori.com to learn more or start a free trial.
Conclusion: Building a Culture of Cloud Cost Visibility
Cloud cost visibility is not a single tool or a one-time project. It is a combination of good practices, consistent processes, and the right platform to bring it all together.
The ten tips in this guide cover the full spectrum: from foundational cost allocation and tagging strategies to advanced unit economics and engineering workflow integration. Apply them progressively. Start with a solid tagging strategy and centralized data. Then move to showback chargeback reporting and team-level budgets. Gradually layer in topology views, shared cost allocation, and unit cost metrics.
The organizations that do this well share one common trait. They treat cloud spending as a shared responsibility across engineering, product, and finance. Cost visibility is not owned by one team. It is embedded in how everyone works.If you are looking for a platform that brings all of these capabilities together across AWS, GCP, and Azure, Holori offers unified multi-cloud cost visibility, virtual tagging, showback and chargeback reporting, and topology-based cost attribution. It is built for teams that want real cloud spend visibility, not just another billing export.