Most cloud cost reports share the same problem: they were built for the person who created them, not the people who need to act on them. A FinOps analyst who understands billing data in detail will produce a report full of service-level breakdowns, utilization percentages, and coverage rates that make complete sense to another FinOps practitioner and almost none to a CFO or a product engineer. The report gets shared, skimmed, and filed. Nothing changes.
Effective cloud cost reporting is not about producing more data. It is about delivering the right data to the right audience in a format that drives a specific decision or action. Engineering teams, finance stakeholders, and leadership each have different questions, different levels of technical context, and different timeframes they are optimizing for. A reporting structure that serves all three requires deliberate design, not a single dashboard distributed to everyone.
This guide covers how to build a cloud cost reporting practice that gets used: the foundational requirements that make any report reliable, how to structure reports for each audience, the cadence that keeps reporting actionable rather than ceremonial, and the common mistakes that make cloud cost reports easy to ignore.
Why Most Cloud Cost Reports Fail
Before addressing what good cloud cost reporting looks like, it is worth understanding why most attempts fall short. The failure modes are consistent across organizations of all sizes.
The first is attribution gaps. According to analysis by CloudZero, 87% of organizations use tagging as their primary allocation method and on average allocate just 75% of cloud costs. A report built on data where 25% of spend is unattributed is not just incomplete: it is actively misleading. Finance cannot reconcile it against budgets. Engineering cannot take ownership of costs they cannot identify. Leadership cannot assess whether cloud investment is aligned with business priorities. Before investing in reporting infrastructure, allocation accuracy needs to be above 85% or the reports will generate more confusion than clarity.
The second failure mode is audience mismatch. A raw billing breakdown from AWS Cost Explorer is accurate but not useful for a CFO who needs to understand whether cloud spend is growing proportionally to revenue. A high-level total spend chart is not useful for an engineer who needs to understand which specific service in their team’s stack is driving a cost anomaly. Sending the same report to everyone means it is genuinely useful to nobody.
The third is a lack of action triggers. A report that shows what happened last month without flagging what needs to change this month is an archive, not a management tool. Every cloud cost report should have a clear answer to the question: what should someone do differently as a result of reading this?
The Foundation: Getting Allocation Right Before Building Reports
Cloud cost reporting is only as reliable as the underlying cost allocation. One of the core principles of FinOps is that cost data must be accessible and timely, and sharing real-time, clear, and actionable cost data helps ensure everyone stays informed and accountable. That accessibility starts with knowing who owns what.
The minimum allocation model for reliable reporting should cover at least four dimensions: the team or business unit that owns the resource, the product or application it belongs to, the environment it runs in (production, staging, development), and the cloud provider and account it sits in. These four dimensions give you enough granularity to route cost data to the right owner without requiring a tagging taxonomy so complex that engineering teams cannot maintain it.
In multi-cloud environments, normalization is an additional prerequisite. AWS, Azure, and GCP export billing data in different schemas with different terminology, different cost dimensions, and different levels of granularity. A compute instance is an EC2 instance on AWS, a Virtual Machine on Azure, and a Compute Engine instance on GCP. Many organizations are adopting the FOCUS specification from the FinOps Foundation, a common schema designed to standardize cloud billing data, to streamline this normalization process. Without normalization, multi-cloud cost reports require manual reconciliation that delays reporting and introduces errors.
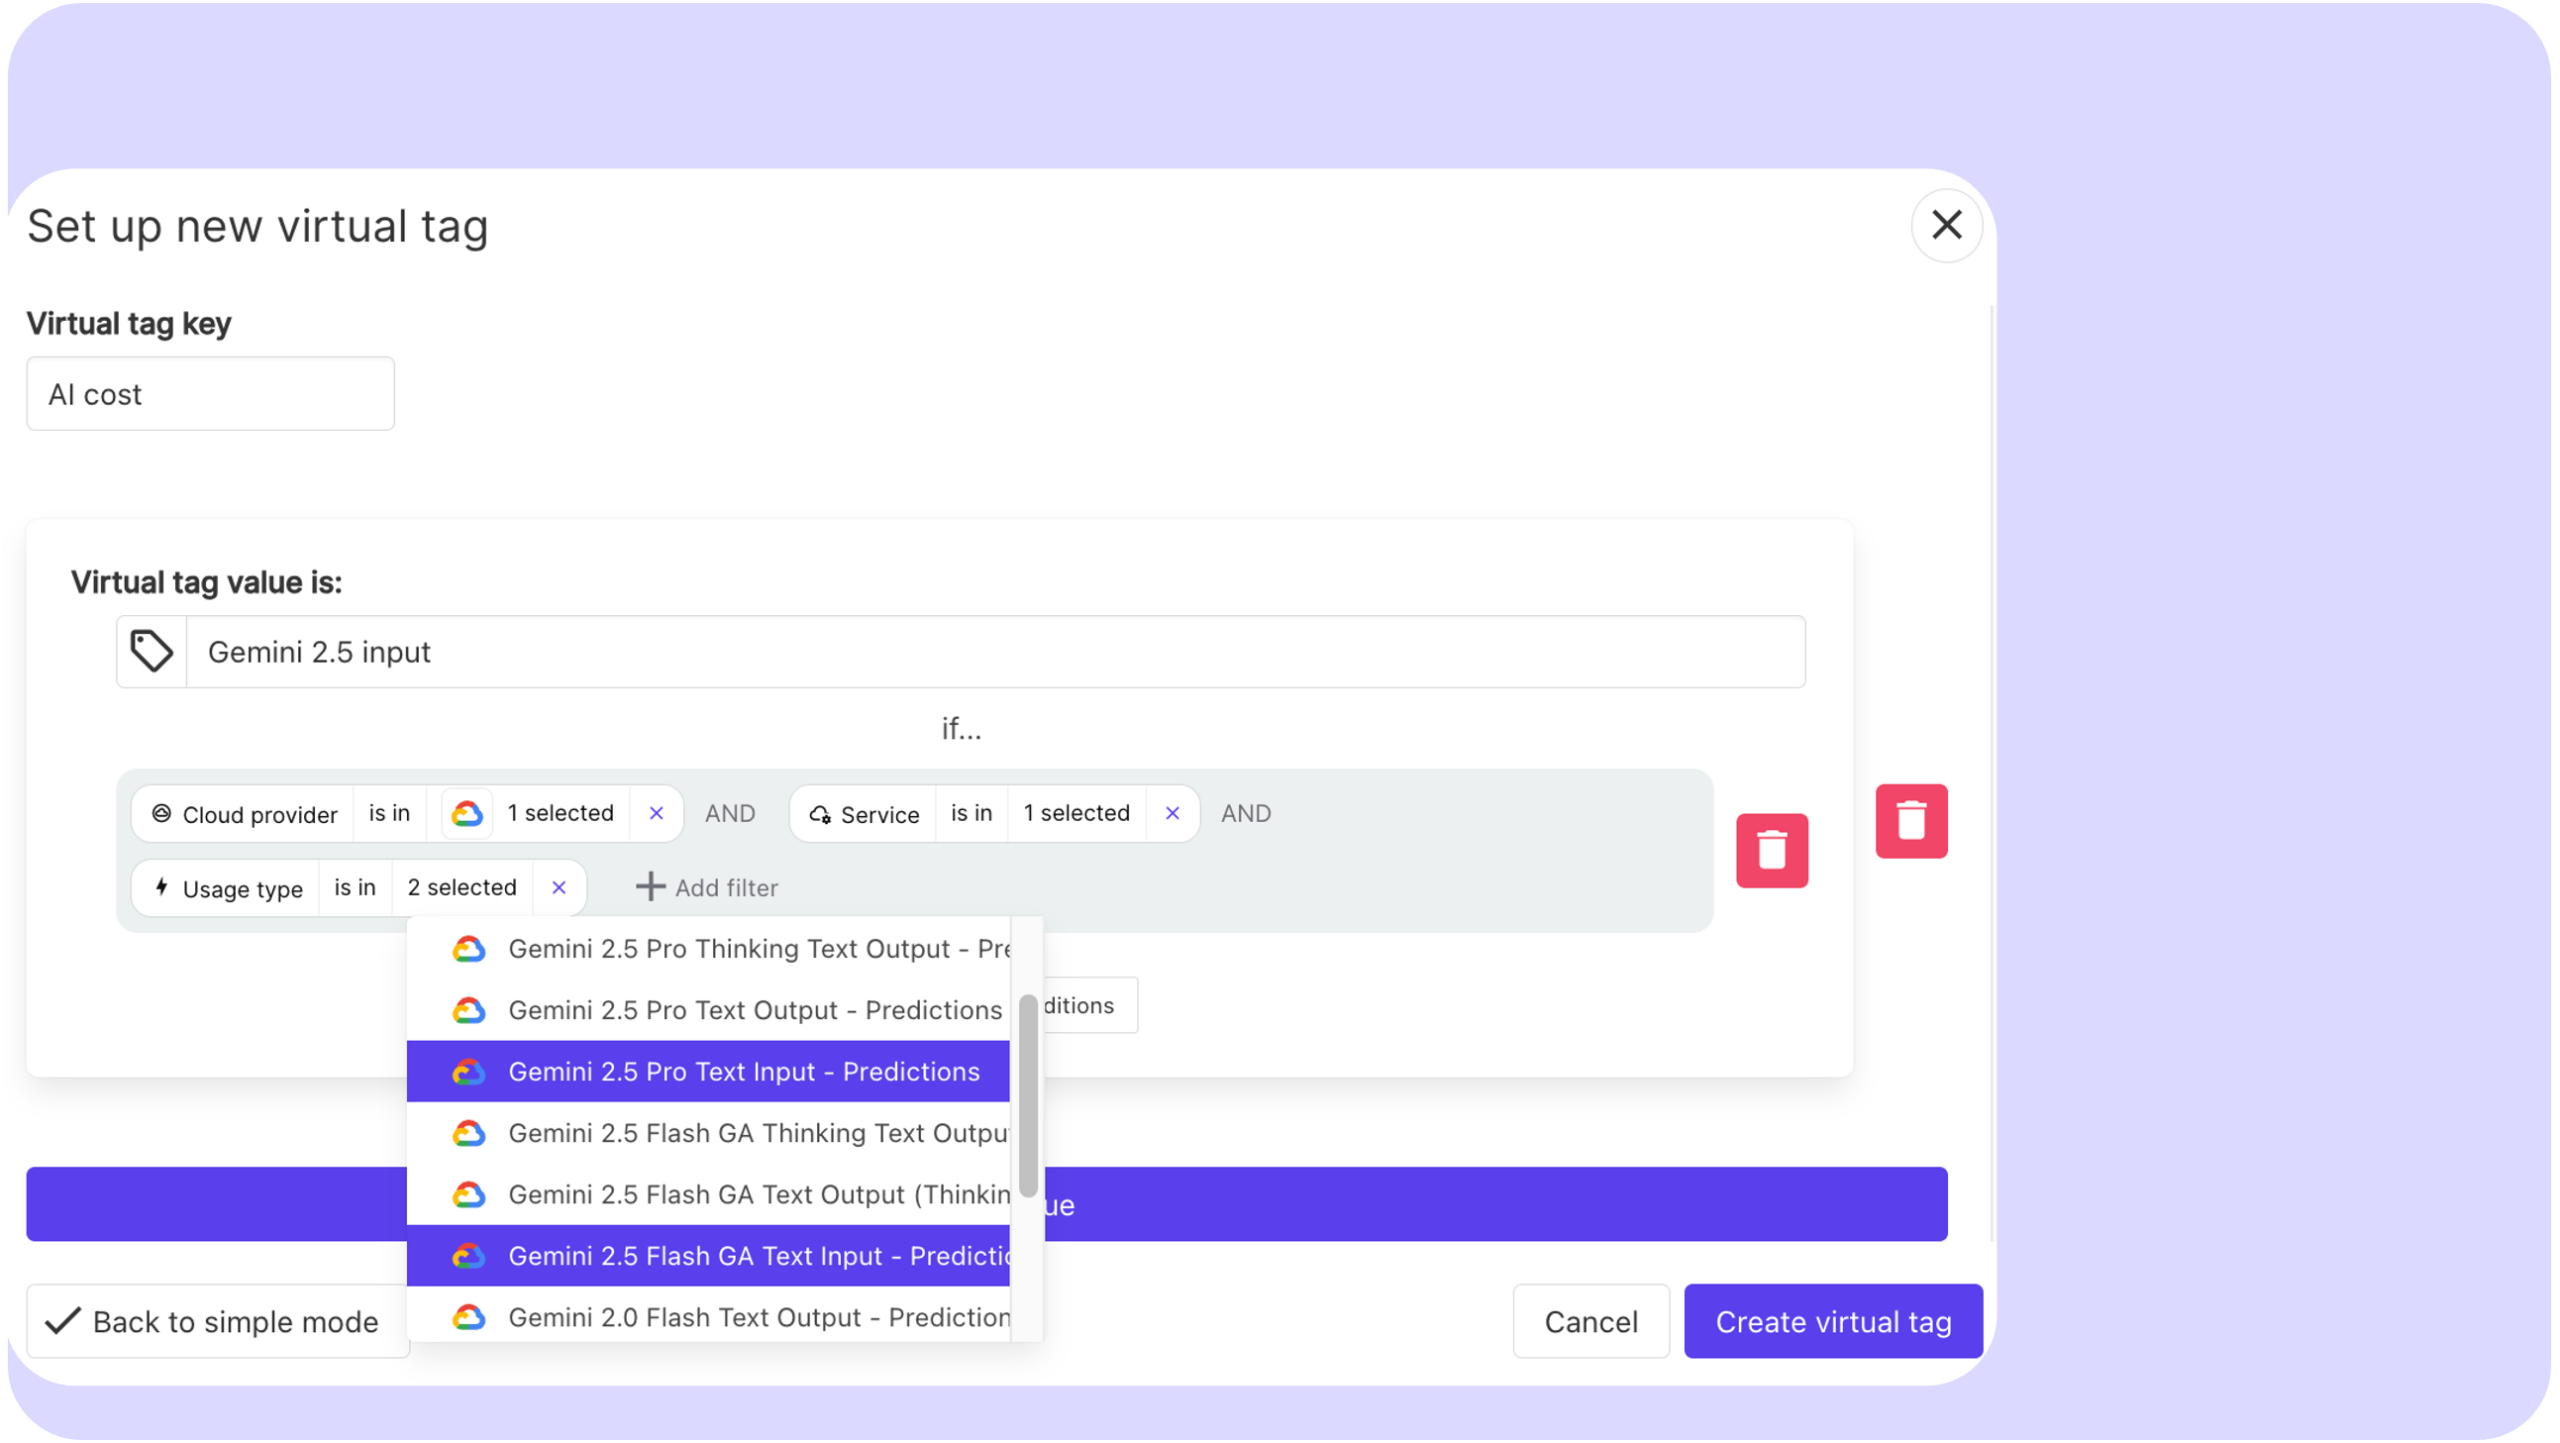
Virtual tagging addresses the gap between what is tagged in the cloud provider and what needs to be allocated for reporting purposes. Rather than requiring infrastructure changes every time the allocation model evolves, virtual tags let FinOps teams apply allocation rules at the reporting layer, which is significantly faster and does not create dependencies on engineering teams to update resource tags retroactively.
Cloud Cost Reporting for Engineering Teams
Engineering teams are the primary drivers of cloud cost. They provision resources, write the code that determines how those resources are used, and make the architecture decisions that define the cost structure of each service. They are also the audience most likely to act on cost data if it is presented in terms that connect to their work.
The most important design principle for engineering-facing reports is specificity. A report that shows total cloud spend for a team is less useful than one that breaks down spend by service, environment, and resource type. An engineer who can see that their data pipeline is running $3,400 per month in EC2 costs across 14 instances, with an average CPU utilization of 22%, has enough information to form a hypothesis and take action. An engineer who can see only that their team spent $18,000 last month on AWS has no actionable starting point.
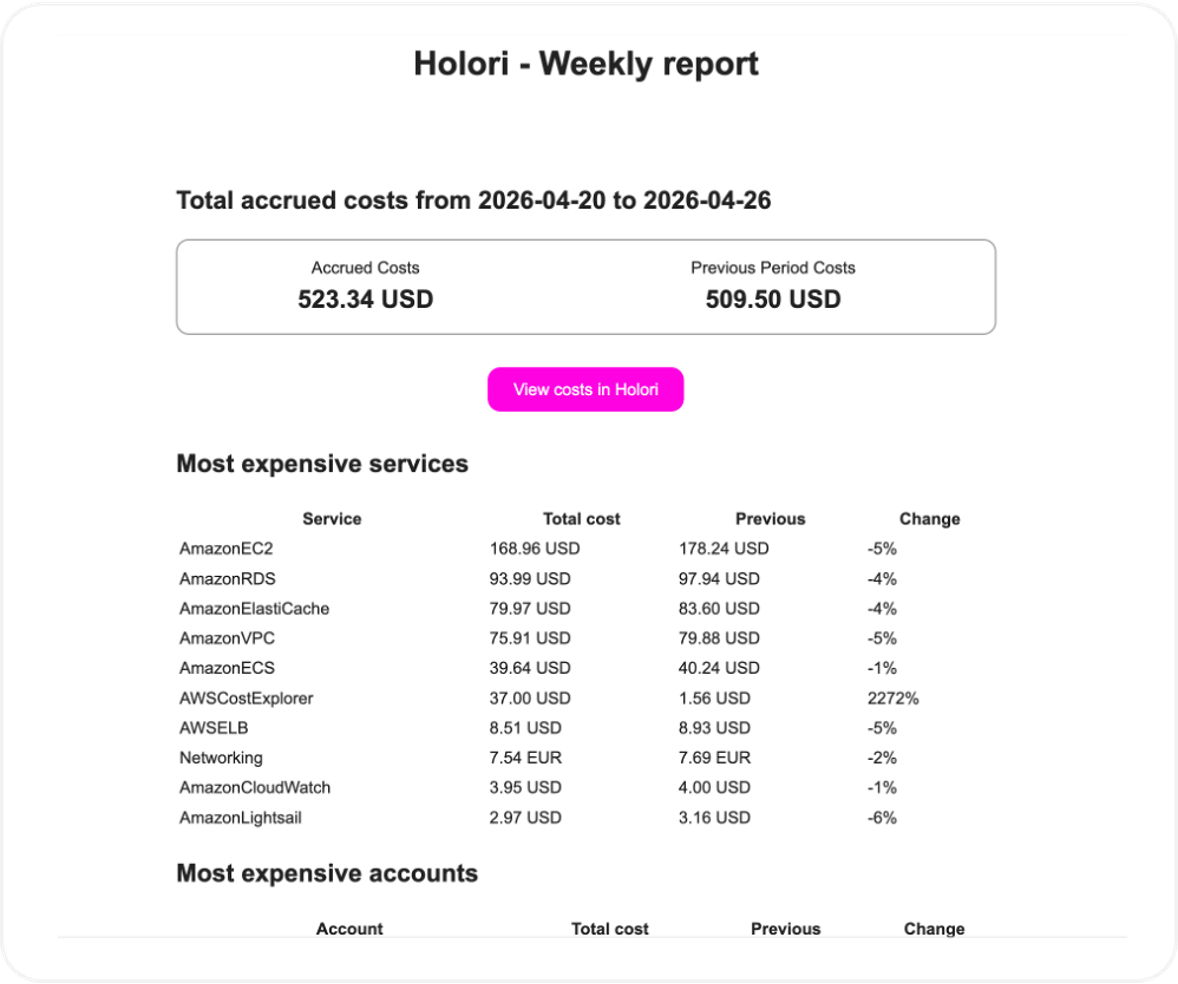
Engineering reports should always include a comparison to the previous period, so teams can see whether costs are trending up, down, or flat relative to recent activity. Unexplained increases should be flagged explicitly rather than left for the reader to identify by scanning numbers. Anomaly detection that surfaces specific resources or services driving unexpected spend is more useful to engineering teams than any chart, because it tells them exactly where to look.
The metrics engineering teams find most useful are utilization rates by service, waste indicators (unattached volumes, idle instances, oversized resources), cost per deployment or cost per environment, and coverage rate for the commitments that apply to their workloads. Framing these as efficiency metrics rather than budget metrics reduces resistance. An engineer is more likely to engage with “your staging environment has 40% idle compute” than “your team is 15% over budget.”
The reporting cadence for engineering teams should be weekly for anomaly alerts and monthly for structured reviews. Weekly cadence is necessary because engineering activity changes quickly and a cost spike that goes undetected for a full month can be expensive. The monthly review gives enough time horizon to assess trends and evaluate optimization actions taken in previous periods.
Cloud cost Reporting for Finance Teams
Finance teams have a fundamentally different relationship with cloud cost data. They are not making infrastructure decisions. They are responsible for budget management, financial forecasting, accruals, and ensuring that cloud spend is reconciled against approved budgets and financial plans. The questions they need answered are different from engineering’s questions, and the data they need is structured differently.
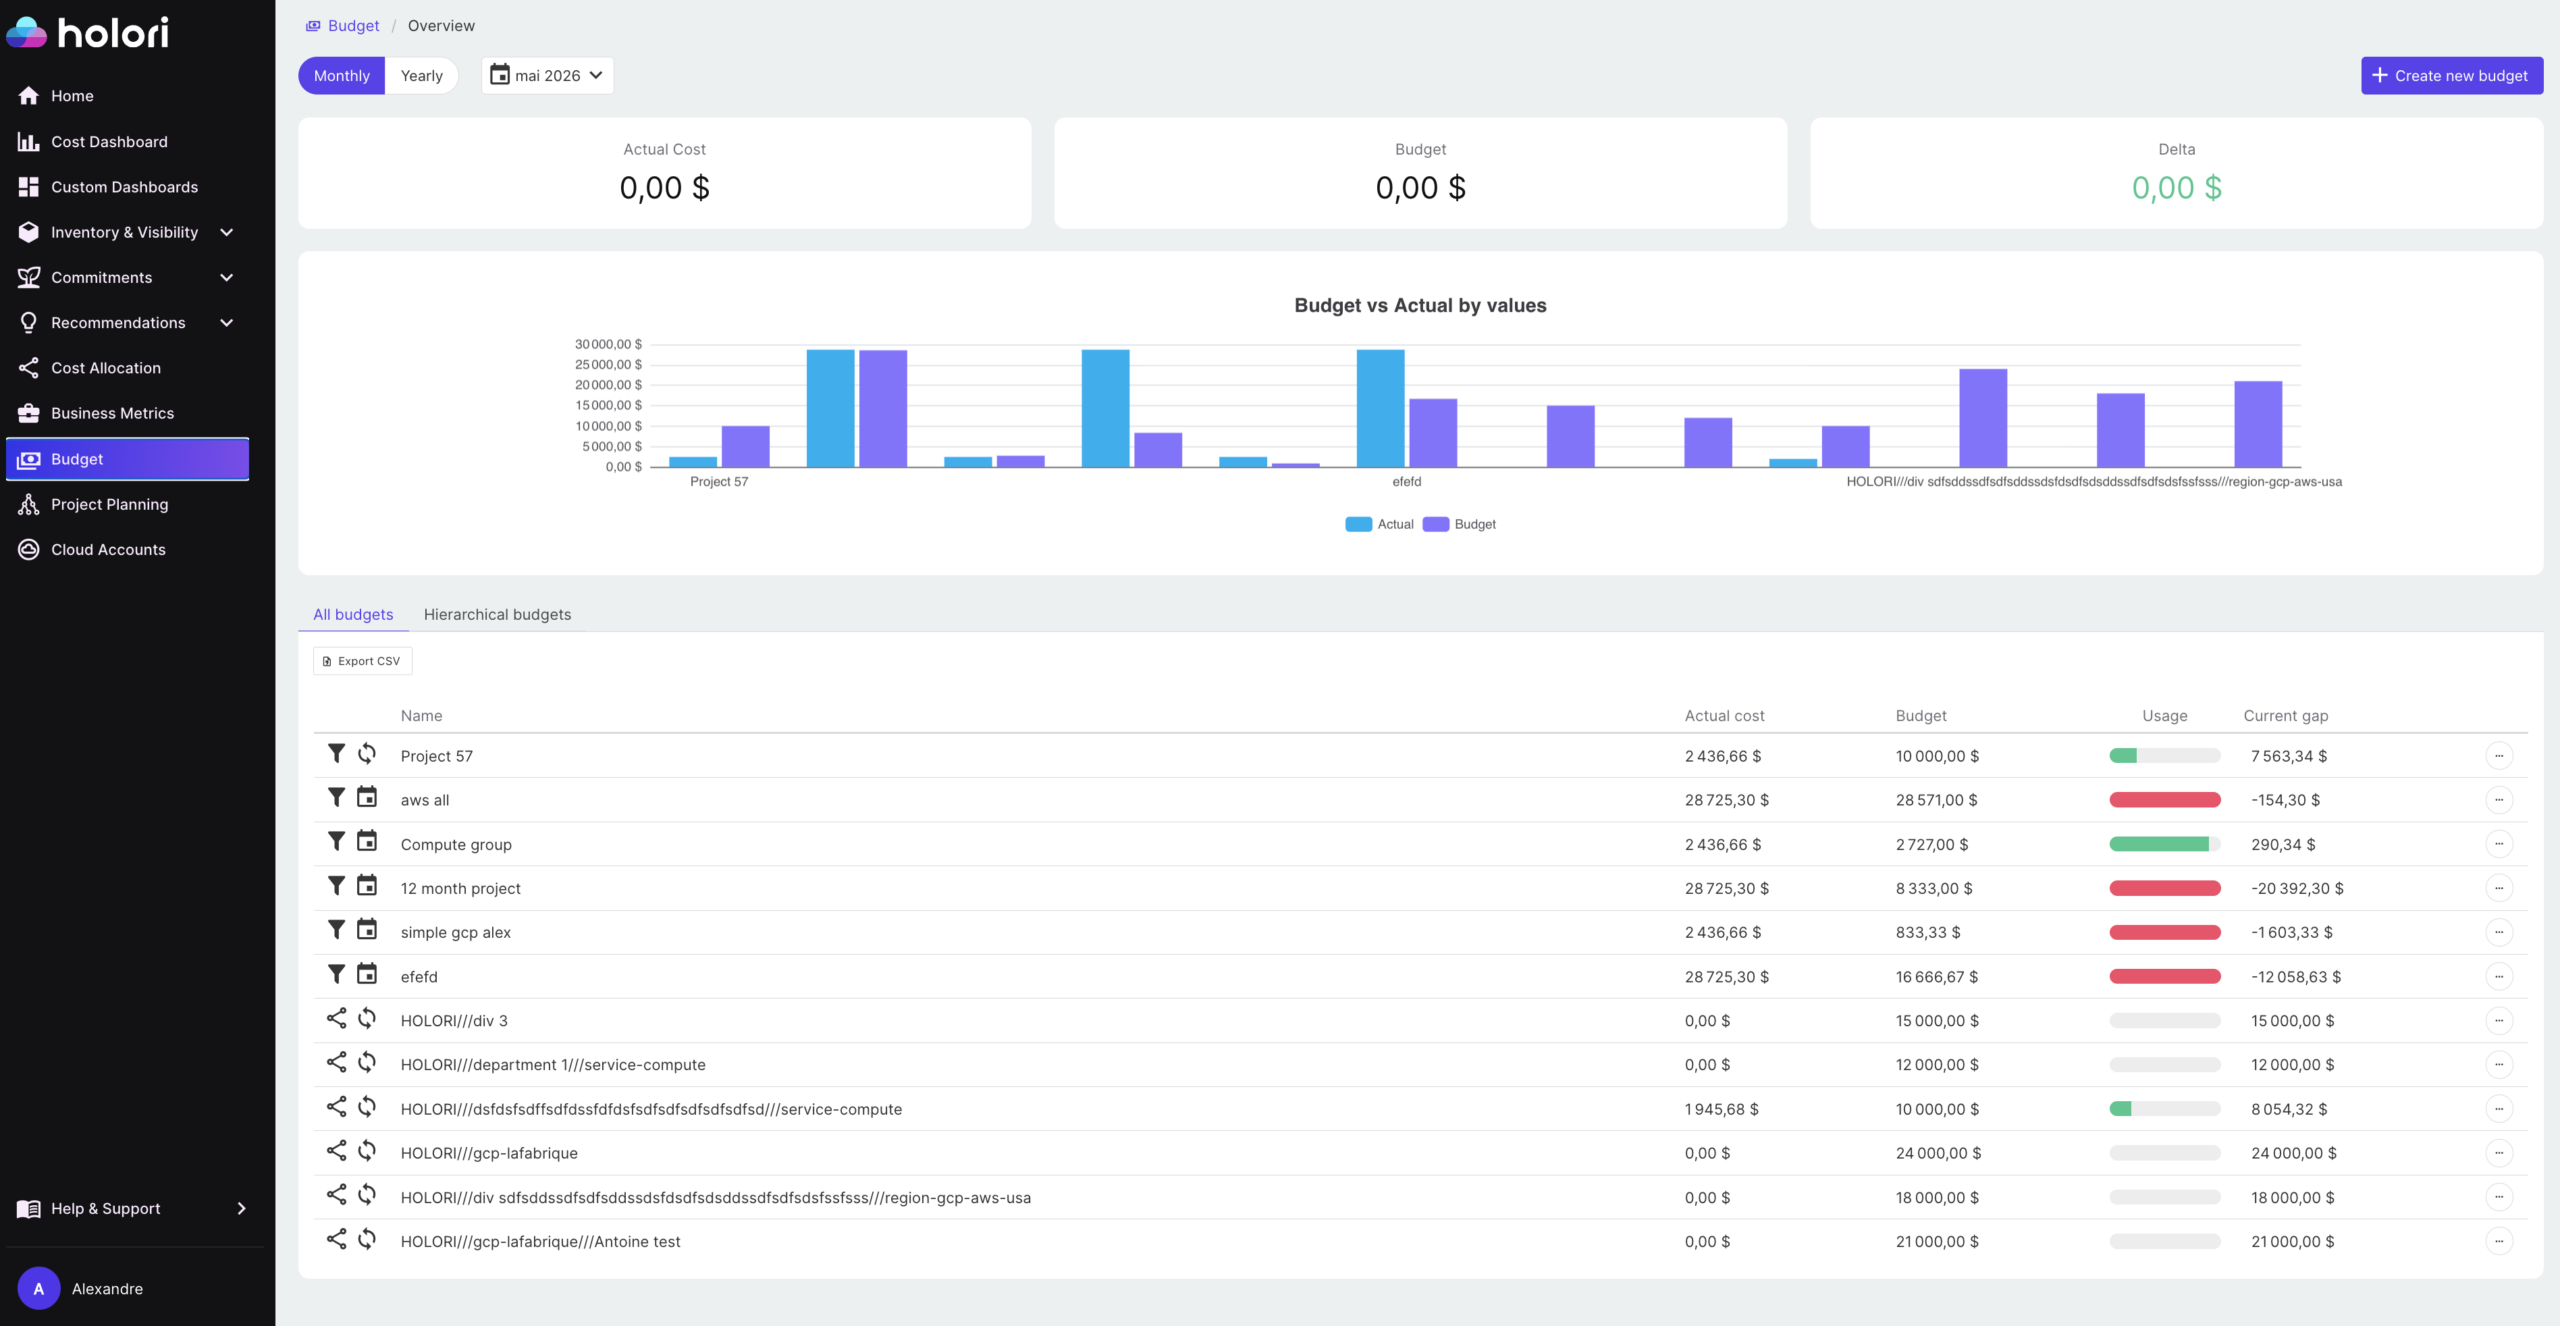
The primary metrics for finance-facing reports are total cloud spend by business unit or cost center, budget variance (actual versus forecast), month over month and year over year trends, and commitment amortization. Finance teams also need to understand the difference between blended and unblended costs, and between amortized and non-amortized commitment spend, because these affect how costs appear in financial statements and how they should be booked.
Showback and chargeback reports are primarily a finance concern. Showback reports allocate costs to teams for visibility without transferring financial responsibility. Chargeback reports generate internal invoices that teams are actually charged against their departmental budgets. Both require high allocation accuracy to be credible. A chargeback report with 20% of spend in an unallocated bucket generates disputes and erodes trust in the reporting system.
Finance reports should present cloud spend in the same structure as the rest of the financial plan: by cost center, by business unit, by quarter. Switching between how cloud costs are reported and how everything else is budgeted creates reconciliation work and makes it harder for finance teams to incorporate cloud data into broader financial models. The closer the cloud cost reporting structure mirrors the general ledger structure, the less friction the finance team experiences.
The cadence for finance reporting is typically monthly, aligned to the financial close cycle. Many organizations also run a mid-month variance check to give finance and budget owners early warning of significant deviations before month end, when there is still time to investigate the cause rather than just record the outcome.
Cloud cost Reporting for Leadership
Leadership reports have the shortest read time and the highest stakes. A CTO, CFO, or CEO reviewing cloud costs does not want a breakdown of S3 storage classes. They want to understand three things: is cloud spend under control, is it delivering value, and are there any significant risks or opportunities on the horizon.
The most effective leadership reports present cloud spend as a business metric rather than a technical one. Cloud spend as a percentage of revenue, unit cost trends (cost per customer, cost per transaction), and forecast accuracy are the metrics that connect cloud investment to business outcomes. A leadership report that shows total cloud spend went up 12% last month without any context is not useful. A report that shows cloud spend grew 12% while active users grew 18%, meaning unit cost improved, tells a story.
Leadership reports should be short. A single page or a three to five slide summary covering total spend trend, budget status, key cost drivers for the period, and one or two forward-looking items (upcoming commitment renewals, forecasted budget pressure, a significant optimization opportunity) covers everything a senior leader needs without requiring them to understand FinOps in detail.
The cadence for leadership reporting is monthly at minimum, with a quarterly review that places cloud costs in the context of the broader technology budget and business performance. Quarterly reviews are also the right forum for strategic conversations about commitment purchasing decisions, significant architecture changes with cost implications, and FinOps program progress against defined targets.
Building a Reporting Cadence That Sticks
A common mistake is treating cloud cost reporting as a monthly deliverable rather than an ongoing process with different rhythms for different audiences. Making it a standard practice to generate and circulate cost reports at least monthly, broken down by team, project, environment, or business unit, ensures everyone stays informed and accountable. But monthly is the floor, not the ceiling.
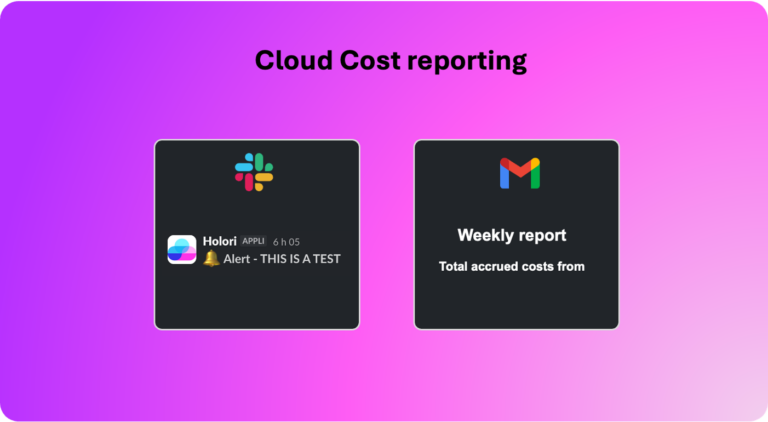
A practical reporting cadence looks like this: daily anomaly alerts routed automatically to the relevant team or service owner when spend deviates beyond a defined threshold; weekly engineering summaries covering the previous week’s spend, top cost drivers, and any flagged anomalies; monthly reports for finance covering budget variance, allocation summary, and trend analysis; and monthly leadership summaries covering business-aligned metrics and forward-looking items.
Automation is essential for this cadence to be sustainable. Reports that require manual assembly every month will eventually be deprioritized. The goal is a reporting system where the data flows automatically into the right format for each audience, with human review focused on interpretation and action rather than data preparation.
Common Mistakes to Avoid
Several patterns consistently undermine cloud cost reporting programs regardless of the tooling in place.
Reporting before allocation is reliable produces noise rather than insight. If a significant portion of spend is unattributed, fix the allocation model before investing in report design. The reports are only as trustworthy as the data underneath them.
Using the same report for every audience is the most widespread mistake. The instinct to standardize is understandable, but it produces reports that are too technical for leadership and too high-level for engineering. Audience-specific reports take more effort to set up but generate significantly more engagement and action.
Reporting without recommendations leaves the audience with data but no direction. Every report sent to an engineering team or a finance stakeholder should include at least one clear action item: a specific optimization opportunity, a budget deviation that needs investigation, or a commitment decision that is approaching. Reports that present information without prompting action become background noise.
Finally, infrequent reporting creates a gap between when costs are incurred and when they are reviewed. In a cloud environment where spend can change significantly within days, monthly-only reporting means problems are discovered weeks after they started. Anomaly detection and automated alerts fill this gap between scheduled reporting cycles.
How Holori help you build better Cloud Cost Reports
Holori is built to address the core challenges of cloud cost reporting in multi-cloud environments. Cost data from AWS, Azure, and GCP is normalized into a consistent format, eliminating the manual reconciliation work that delays reporting in environments running across multiple providers. Virtual tagging allows allocation rules to be applied and adjusted without changing how resources are tagged in the cloud provider, which means the reporting structure can evolve as the business changes without creating dependencies on engineering teams.

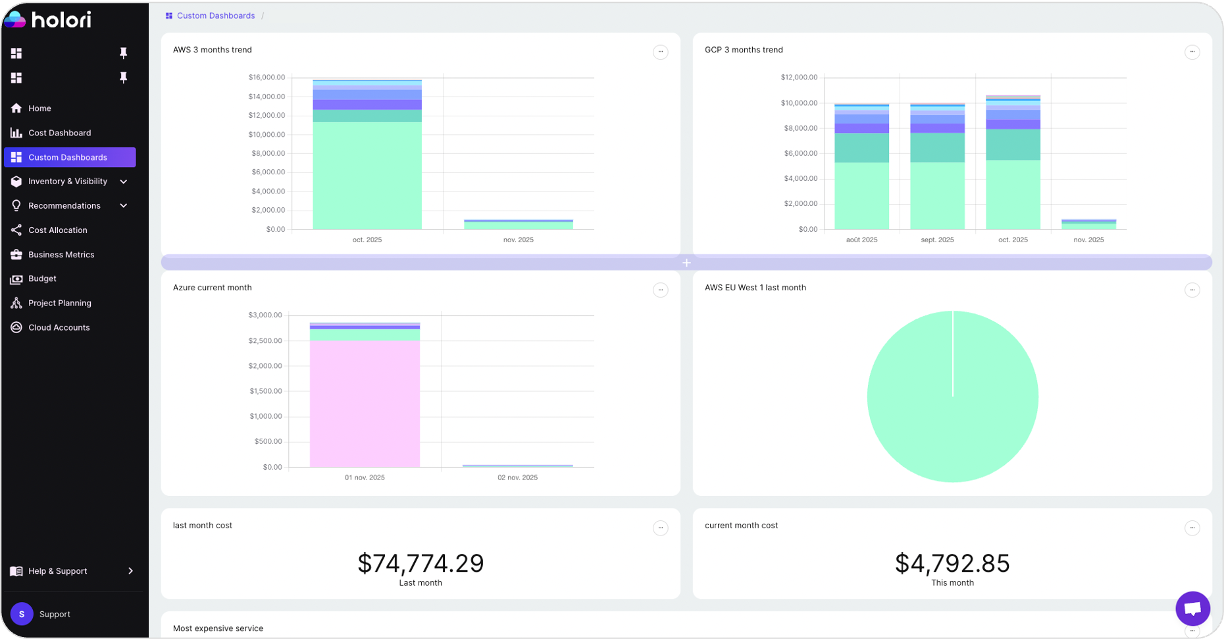
Team-level and service-level cost views give engineering teams the specificity they need to act on cost data, while summary views and business-aligned metrics give finance and leadership the context they need for budget management and strategic decisions. Anomaly detection surfaces unexpected cost movements in real time, feeding directly into the daily alert layer of a well-structured reporting cadence.
For organizations managing cloud costs across multiple providers, Holori’s infrastructure diagrams also provide a visual layer that complements tabular reporting: showing resource relationships, attached and unattached disks, idle instances, and cross-account dependencies in a format that is immediately interpretable by both technical and non-technical stakeholders.
Cloud cost reporting does not need to be complex to be effective. It needs to be accurate, audience-specific, and connected to clear actions. Build it on a reliable allocation foundation, design it for the people who need to act on it, and automate the delivery cadence so it runs consistently without manual effort. When those three elements are in place, cloud cost reports stop being a monthly obligation and start being a management tool.
Try Holori fro free now: https://app.holori.com/