Most engineering and finance teams have access to more cloud billing data than they know what to do with. AWS Cost Explorer, Azure Cost Management, and Google Cloud Billing each surface hundreds of line items per month. Yet organizations consistently report that they cannot answer a simple question: where exactly is our cloud money going, and is it well spent?
This is the core challenge that cloud cost analysis is designed to solve. Raw billing data is not insightful. A $200,000 monthly invoice tells you almost nothing on its own. Effective cloud cost analysis transforms that raw data into decisions: which workloads to rightsize, which commitments to purchase, which teams are spending beyond forecast, and which services are generating cloud waste.
This guide covers the full cloud cost analysis process end to end. It is written for FinOps practitioners, platform engineers, and engineering leaders. Those who want to move beyond dashboards and start driving real financial outcomes from their billing data.
What Cloud Cost Analysis Actually Means
Cloud cost analysis is the structured process of collecting, normalizing, attributing, and interpreting cloud billing data. The goal is to produce insights that engineering, finance, and leadership teams can act on. It is not a one-time audit. It is a continuous discipline that sits at the core of any mature FinOps practice.
The difference between reporting and analysis is important. Reporting tells you what happened. Analysis tells you why it happened and what you should do about it. A team that reports monthly cloud spend is doing reporting. A team that identifies a 23% cost spike in EC2, traces it to a new feature deployment. Then flags the team owner, and implements a rightsizing recommendation within a week is doing cloud cost analysis.
Effective cloud cost analysis requires four things to work well together: clean, attributed data; a defined analytical framework; tools that surface insights rather than just numbers; and a process that connects insights to decisions. Most organizations have some version of all four but fail to integrate them into a coherent workflow.
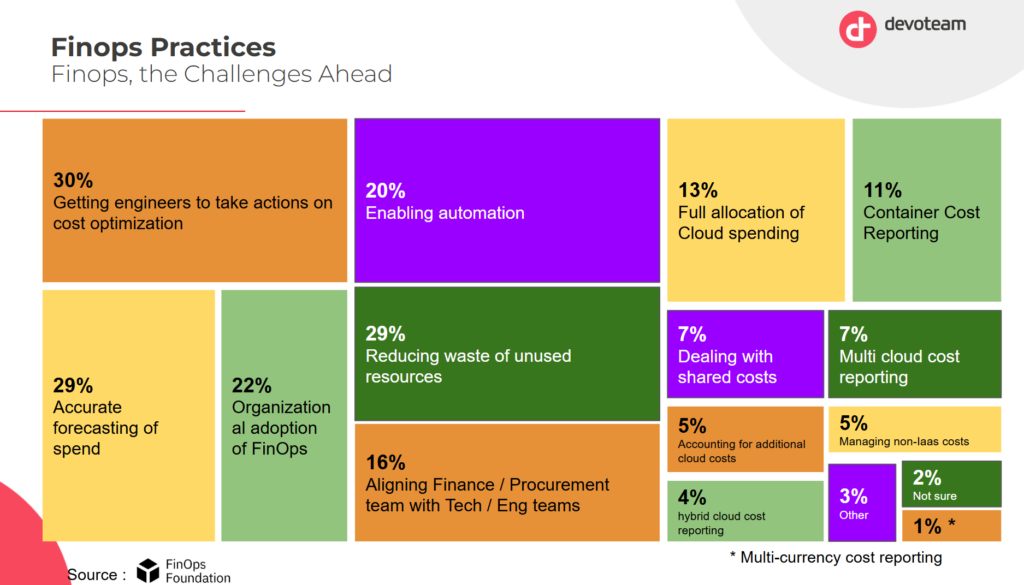
As you can see in this analysis by Devoteam and the FinOps Foundation, taking actions is indeed a critical FinOps priority. This can only be achieved using actionable insights.
Step 1 — Establish a Reliable Cost Allocation Foundation
No cloud cost analysis framework can function without reliable cost attribution. Before you can understand what you are spending, you need to know who is spending it and on what.
Cost allocation is the process of assigning cloud spend to specific owners: a team, a product, a business unit, or an environment. The standard mechanism is resource tagging. Every cloud resource carries metadata tags that indicate its owner, environment, and purpose. Billing exports then group costs by those tags.
In practice, tagging is never perfectly clean. Resources created by automated pipelines, third-party integrations, or new team members often lack required tags. Industry data consistently shows that 15 to 30% of cloud spend in medium and large organizations sits in untagged or miscategorized buckets. Any cloud cost analysis built on top of that data is unreliable.
There are two approaches to fixing this. The first is enforcement: implement tag policies at the account or organization level that block resource creation without required tags. AWS Service Control Policies, Azure Policy, and GCP Organization Policy all support this. The second is remediation through virtual tagging. This allows cost allocation rules to be applied retroactively to untagged spend without requiring changes to the underlying infrastructure. Virtual tagging is particularly valuable in multi-cloud environments where tagging conventions differ across providers.
Your cost allocation rate (the percentage of total spend attributable to a specific owner) is the foundation metric for all downstream analysis. Target 90% or above before investing heavily in optimization work. Optimization built on incomplete attribution often targets the wrong resources.
Step 2 — Normalize Your Billing Data Across Providers
Organizations running workloads on multiple cloud providers face a structural challenge: each provider formats its billing data differently. AWS uses Cost and Usage Reports (CUR) with its own service nomenclature. Azure exports cost data in a format that differs significantly from AWS in both schema and dimension naming. GCP uses BigQuery-based billing exports with its own hierarchy of projects, folders, and billing accounts.
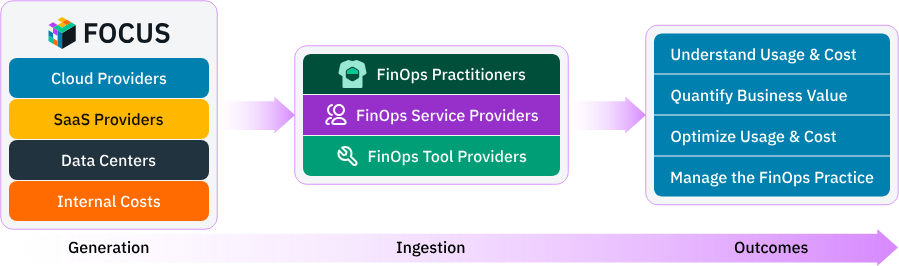
Running meaningful cloud cost analysis across providers requires normalizing this data into a common schema. The FinOps Foundation’s FOCUS (FinOps Open Cost and Usage Specification) standard was designed exactly for this purpose. FOCUS defines a common set of dimensions, metrics, and terminology that allows billing data from different providers to be compared in the same analysis. Adopting FOCUS, or working with a platform that normalizes to FOCUS, is one of the highest-leverage investments a multi-cloud team can make in its analytical infrastructure.
Beyond schema normalization, you also need to normalize for amortization. Cloud billing includes two categories of charges: usage-based charges (on-demand compute, storage, egress) and commitment-based charges (Reserved Instances, Savings Plans, Committed Use Discounts). Commitment charges are often billed upfront or monthly regardless of usage. Amortizing those charges daily across the resources they cover gives you a true picture of cost by service, team, and period. Without amortization, commitment costs create noise in your day-to-day analysis and make period-over-period comparisons unreliable.
Step 3 — Identify and Segment Cloud Spend by Driver
Once your data is attributed and normalized, the analytical work begins. The first question is: what is actually driving cloud spend? The answer is almost never a single service or team. It is a combination of factors that need to be disentangled.
The most useful segmentation dimensions for cloud cost analysis are service type, environment, team or product owner, region, and time period. Segmenting by these dimensions in combination reveals patterns that aggregate numbers hide. A team might spend 40% more than forecast, but segment-level analysis shows that the overage is entirely in the development environment. That is a very different problem to solve than if it were in production.
Service-level analysis is particularly valuable. In most cloud environments, 20% of services account for 80% of spend. Identifying those high-spend services and understanding what drives their costs creates a focused optimization agenda. High spend services often include for example the compute hours, data transfer, API calls, storage volume. Diffuse efforts to cut costs everywhere rarely succeed. Targeted analysis of the top five or ten cost drivers almost always does.
Time-series analysis is equally important. Cloud spending patterns change over time. Growth-driven increases look different from inefficiency-driven ones. If a service’s cost increases by 30% over a quarter while its utilization stays flat, that is a signal worth investigating. If cost increases 30% while transactions double, the service is actually becoming more efficient. Distinguishing between these two scenarios requires tracking both cost data and usage metrics in the same analysis.
Step 4 — Detect Anomalies Before They Compound
Cloud cost anomalies are unexpected deviations from normal spending patterns. They can result from a misconfigured autoscaling group, a runaway batch job, a forgotten development environment, an accidental data transfer, or a security incident generating unusual activity. Left undetected, cost anomalies compound quickly. A misconfiguration that generates an extra $500 per day undetected for three weeks produces $10,500 in avoidable waste before it shows up on a monthly bill.
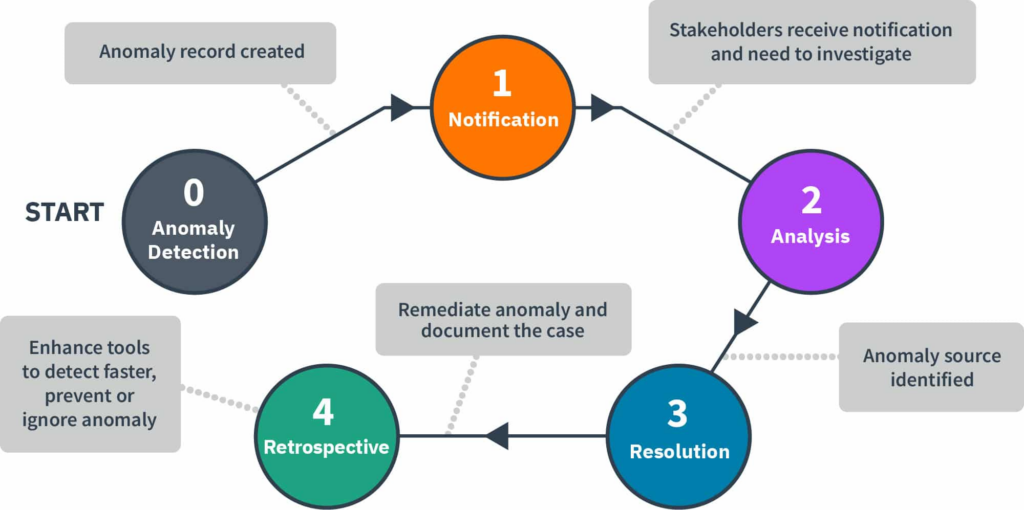
Effective cloud cost analysis includes a real-time anomaly detection layer. The goal is to flag unexpected cost movements within hours, not weeks. Detection requires establishing a cost baseline for each service, team, and environment, then alerting when observed spend deviates beyond a defined threshold from that baseline.
Simple threshold alerting, alert when spend exceeds a fixed dollar amount, catches large anomalies but misses proportional ones. A $100 overage on a $500-per-day service is significant. The same $100 overage on a $50,000-per-day service is noise. Percentage-based alerting handles this better. The most sophisticated anomaly detection systems combine percentage thresholds with statistical baseline modeling, accounting for day-of-week and seasonal patterns so legitimate traffic spikes do not generate false positives.
When an anomaly is detected, the analysis workflow should include attribution (which team and resource generated it), root cause investigation (what changed in that service or its traffic), and a remediation action.
A metric worth considering in my opinion is anomaly-detected cost avoidance. Basically tracking the estimated spend prevented by catching and resolving an anomaly before it ran its full course.This is a valuable metric for demonstrating the ROI of investing in alerting infrastructure. You can learn more about building this system in our dedicated guide on cloud cost anomaly detection.
Step 5 — Analyze Commitment Coverage and Discount Efficiency
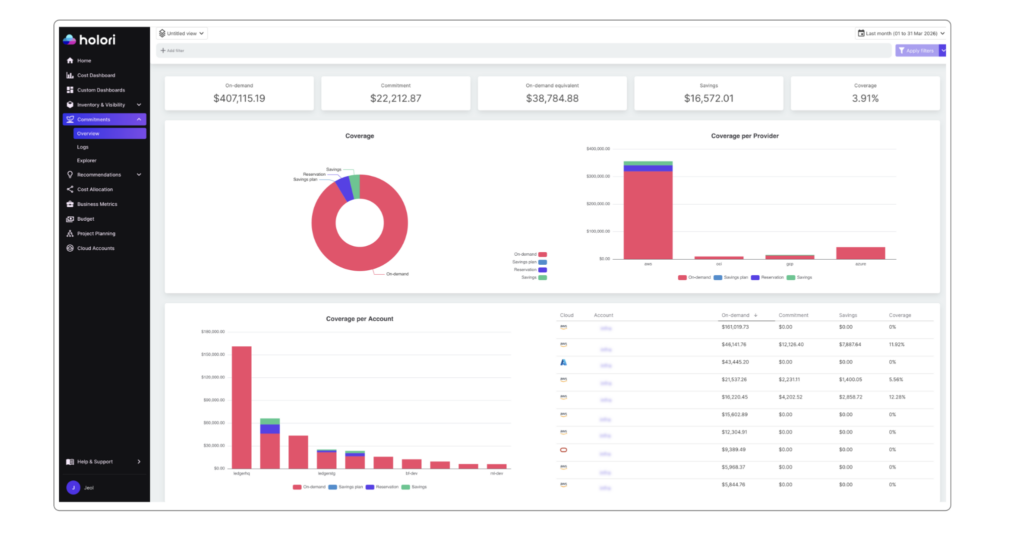
Image: commitments tracking in Holori FinOps tool
On-demand pricing is the most expensive way to run cloud infrastructure. Every major provider offers substantial discounts — typically 30 to 60% — in exchange for usage commitments. AWS offers Reserved Instances and Savings Plans. Azure offers Reservations and the Azure Hybrid Benefit. GCP offers Committed Use Discounts in resource-based and spend-based forms.
Commitment coverage analysis is one of the highest-value components of cloud cost analysis because the financial impact is large and the required data is available in every billing export. The core metric is commitment coverage rate: the fraction of eligible on-demand spend covered by a commitment instrument. A well-managed environment typically targets 70 to 85% coverage on stable workloads.
Coverage rate alone is not sufficient. Every commitment carries lock-in risk. A three-year Reserved Instance offers maximum savings but exposes you to financial loss if the workload shrinks or migrates. Commitment analysis must account for workload stability, not just current utilization. The right framework combines coverage rate with a risk assessment of how stable each workload is likely to be over the commitment term.
The Effective Savings Rate (ESR) is the most comprehensive single metric for measuring discount efficiency. It calculates the percentage saved compared to what the same usage would have cost at full on-demand rates, across all discount instruments combined. Teams with a mature strategy typically achieve ESRs between 20 and 40%, depending on workload type and cloud mix.
A complete commitment analysis tracks two things: coverage gaps — services or teams with high eligible spend but low commitment coverage — and specific purchasing recommendations for closing those gaps. Reviewing this analysis quarterly gives your team the lead time needed to act before commitment renewals and before eligible on-demand spend continues to accumulate.
Step 6 — Rightsize Resources Using Usage Data
Rightsizing is the process of matching provisioned resource capacity to actual usage. It is one of the most consistently high-impact cloud cost analysis outputs, and one of the most consistently neglected. The reason is structural: engineers are incentivized to over-provision (failures are visible; idle resources are not), and cost data alone cannot identify rightsizing opportunities without usage metrics to compare against.
Effective rightsizing analysis combines two data sources: billing data (what the resource costs) and monitoring data (how much capacity is actually used). The combination reveals three categories of opportunity.
First is oversized instances: compute resources running consistently below 30 to 40% of provisioned CPU or memory capacity, which can typically be moved to a smaller instance type with no performance impact. Second is idle resources: instances, databases, or load balancers running but serving no active traffic, which should be terminated or stopped outside business hours. Third is mismatched instance families: resources in a general-purpose family that would cost less in a compute-optimized or memory-optimized family for the same effective capacity.
Rightsizing analysis must account for variability. A resource averaging 20% CPU utilization but peaking at 95% during business hours should not be downsized to match the average. The analysis must examine utilization distribution, specifically the 95th or 99th percentile, not just the mean. Tools that optimize only for average utilization frequently generate unsafe recommendations.
For Kubernetes environments, rightsizing adds complexity because costs are allocated at the node level but consumed at the container level. Container-level resource request and limit analysis is required to identify over-requested namespaces and workloads. This is an area where dedicated Kubernetes cost management tools add significant value over provider-native billing analysis. Holori’s Kubernetes cost optimization tool is built for exactly this use case.
Step 7 — Connect Cloud Costs to Business Outcomes
The final layer of cloud cost analysis is connecting spend to business value. Raw cost data tells you what you’re spending. Unit economics tell you whether you’re spending efficiently relative to business outcomes.
The most useful unit cost metric depends on your business model. SaaS companies track cost per active user. API businesses track cost per call or transaction. Data platforms track cost per gigabyte processed or per query. AI products track cost per inference or model training run.
Building unit cost metrics requires correlating cost data with product data — joining billing exports with application telemetry or product analytics. The join key is typically a service name, team identifier, or workload tag present in both sources. Once established, unit cost can be tracked like any other financial metric.
Unit cost analysis answers questions that pure spend analysis cannot. If cloud spend grows 40% year over year, is that good or bad? Without a denominator — active users, transactions, revenue — there’s no way to know. If users grew 80% in the same period, the business became more efficient. If users grew only 15%, something is wrong with how infrastructure scales.
This analysis also enables meaningful budget planning. A cost-per-user target can be set based on margin requirements, then used to project infrastructure budgets from growth forecasts. Engineering teams can be evaluated not just on whether they stayed within budget, but on whether they improved unit economics over time.
For organizations tracking AI workloads, the same logic applies. Cost per inference, per training epoch, and per active AI feature user all connect infrastructure spend to business value in ways that aggregate numbers don’t. Holori supports cost attribution for AI services including AWS Bedrock, Google Vertex AI, and Azure OpenAI within the same allocation and normalization framework as traditional cloud spend.
Common Cloud Cost Analysis Mistakes
The most common mistake in cloud cost analysis is starting with optimization before establishing attribution. Teams invest in rightsizing recommendations or commitment purchasing without reliable cost allocation data. The result is recommendations that target the wrong resources and commitments that cover workloads that are not representative of actual spend distribution.
The second most common mistake is analyzing costs in isolation from usage data. Billing data alone can tell you that a service costs $50,000 per month. It cannot tell you whether that is efficient without knowing what the service is doing. Utilization rates, transaction volumes, and active user counts are all required to contextualize cost data meaningfully.
A third common mistake is over-relying on native provider tools for cross-cloud analysis. AWS Cost Explorer, Azure Cost Management, and GCP Billing Console are each designed for their own platform. Teams with workloads across multiple providers who rely only on native tools are forced to manually reconcile data in spreadsheets, which introduces errors and delays and produces analysis that is outdated before it reaches decision-makers.
Finally, many teams treat cloud cost analysis as a periodic exercise rather than a continuous process. Monthly reviews catch large structural trends but miss the day-to-day anomalies and week-over-week changes that compound into significant waste over a quarter. Effective cloud cost analysis runs continuously in the background, surfacing insights on the cadence needed to act on them.
How Holori Accelerates Cloud Cost Analysis
Holori is a multi-cloud FinOps platform purpose-built for teams that need to turn billing data into action across AWS, Azure, GCP, OCI, and other providers.
For cost allocation, Holori supports virtual tagging, which allows you to apply allocation rules across all providers without requiring infrastructure changes. This is critical for teams that cannot enforce perfect tagging discipline at the infrastructure level. The result is a cost allocation rate that accurately reflects business reality rather than the state of your tagging compliance. Moreover, the visual cost allocation feature makes it extremely easy (cf. picture above).
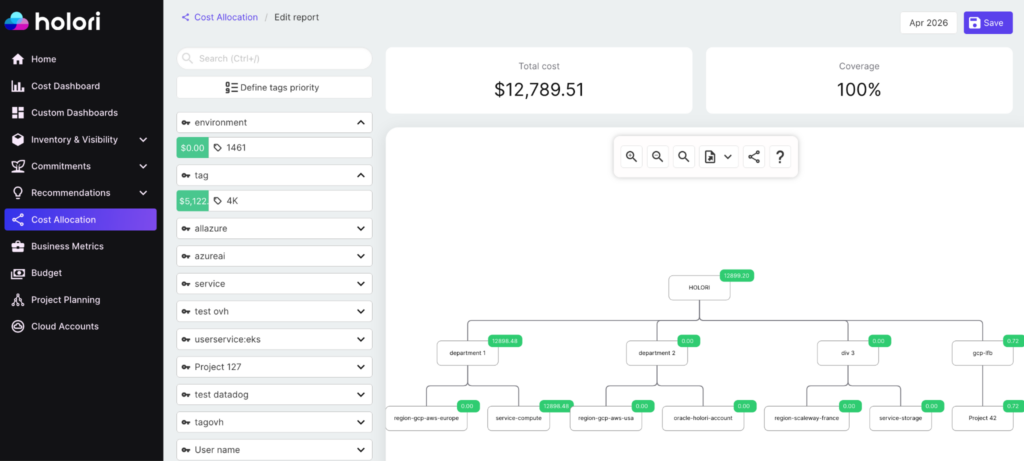
Image: Holori visual cost allocation feature.
For anomaly detection, Holori monitors cost data continuously and alerts when spend deviates from expected patterns. Holori helps bring context to the alerts so investigation time is minimized.
For commitment analysis, Holori tracks coverage rate and effective savings rate across all commitment instruments in a single view. Cross-cloud commitment efficiency is visible without switching between provider consoles.
Recommendations are ranked by potential savings and filtered by risk level so engineering teams can prioritize high-impact, low-risk changes. Kubernetes cost management is supported natively, with container-level usage data mapped to billing data for accurate namespace and workload attribution.
For business alignment, Holori’s cost allocation features support the creation of custom cost dimensions that can be joined with product and revenue data. This enables the unit economics analysis that connects infrastructure spend to business outcomes.
Start your cloud cost analysis today: app.holori.com
Conclusion
Cloud cost analysis is not a reporting exercise. It is a systematic process that transforms billing data into decisions. The process has a natural order: reliable attribution first, normalization second, spend segmentation third, anomaly detection fourth, commitment optimization fifth, rightsizing sixth, and unit economics last. Each layer depends on the one below it.
Organizations that invest in this process at every layer consistently achieve significant reductions in cloud waste, better utilization of commitment discounts, and a clearer understanding of the relationship between cloud investment and business value. Those that skip layers or treat analysis as a periodic activity tend to find themselves explaining the same cost overruns quarter after quarter.
The tools and data to do this well are available to every team running workloads in the cloud. The differentiator is process and discipline and a platform that makes continuous cloud cost analysis simple.