As cloud systems grow ever more complex and distributed, effective visualization of AWS infrastructure is no longer optional, it’s foundational to planning, governance, and team alignment. They have become critical operational tools for cloud architects, DevOps engineers, FinOps teams, and CTOs managing increasingly complex, multi-account AWS environments. That’s the reason why we wanted to guide you through the best AWS diagram tools in 2026.
With the rise of new services and usage, multi-region deployments, and continuous cloud change, traditional static diagrams are no longer enough. Modern AWS diagram tools are now automated, ensure compliance for regulated industries and help teams eliminate blind spots.
In this in-depth guide, fully updated in 2026, we explore the best AWS diagram tools. We help you choose the right solution based on your use case from manual design to fully automated, always-up-to-date architecture visualization.
Why AWS Architecture Diagrams Matter More Than Ever in 2026
AWS environments have evolved dramatically in recent years. What used to be a handful of EC2 instances and VPCs has turned into hundreds or thousands of interconnected resources across multiple AWS accounts and regions.
AWS diagrams now play a critical role in:
- Architecture design & validation
- Cloud onboarding & team knowledge transfer
- Security & compliance audits
- Cost optimization & FinOps analysis
- Incident response & troubleshooting
- Change management & governance
However, the value of a diagram depends on accuracy. A diagram that is outdated by even a few weeks can become misleading, or worse, dangerous.
This is why modern AWS diagram tools in 2026 fall into three major categories:
- Manual diagramming tools
- AI-assisted diagram generators
- Automated AWS discovery & live architecture tools
What Defines a Great AWS Diagram Tool in 2026?
Before reviewing individual tools, let’s define the key criteria that matter today.
1. Accuracy & Cloud Reality
Does the tool reflect what actually exists in AWS, or only what someone thinks exists?
2. Automation & Discovery
Can it connect to AWS APIs and automatically map:
- VPCs, subnets, routing
- EC2, ECS, EKS
- Load balancers
- Databases, storage
- and much more…
3. Scalability
Can it handle:
- Large organizations
- Multiple regions
- Complex architectures
4. Long-Term Maintainability
Does the diagram:
- Update automatically?
- Detect changes?
- Prevent architectural drift?
- Keep track of the infra evolution day after day?
The Best AWS Diagram Tools in 2026
1. Holori
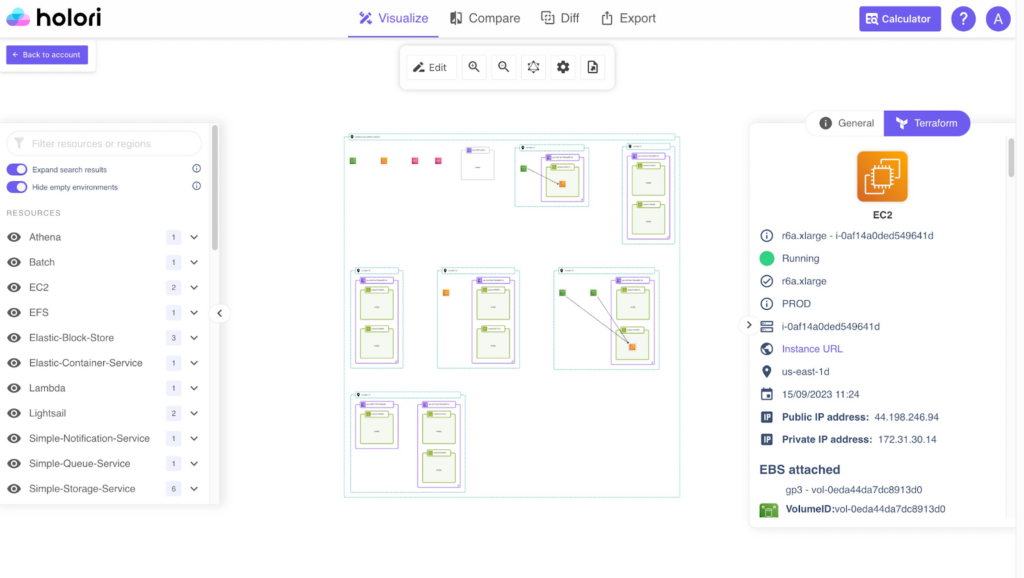
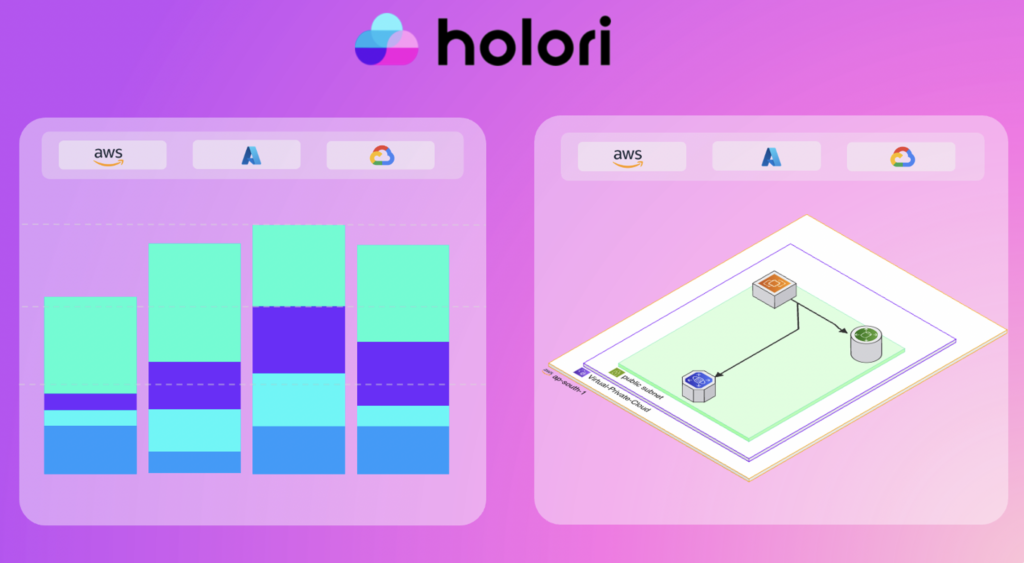
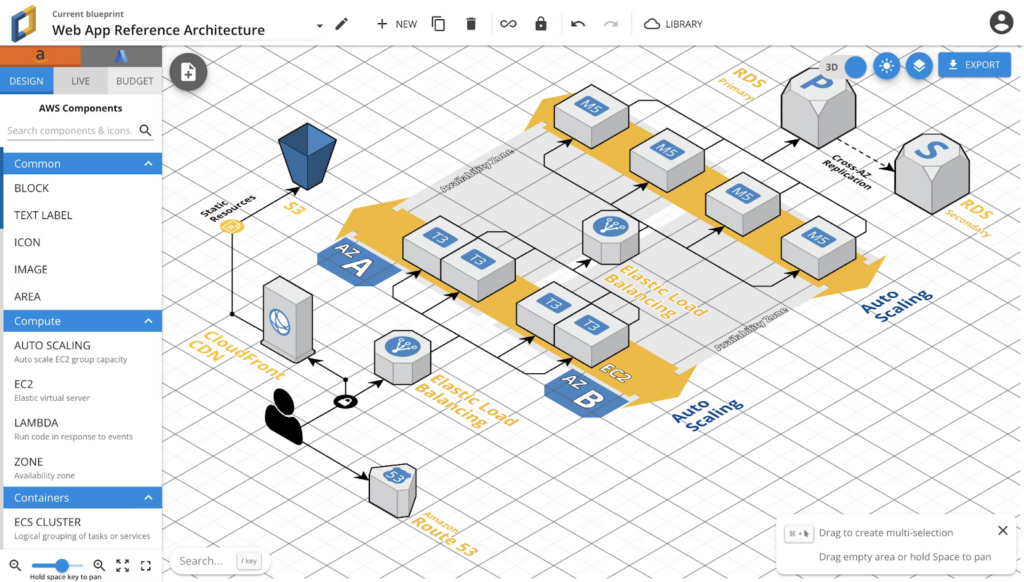
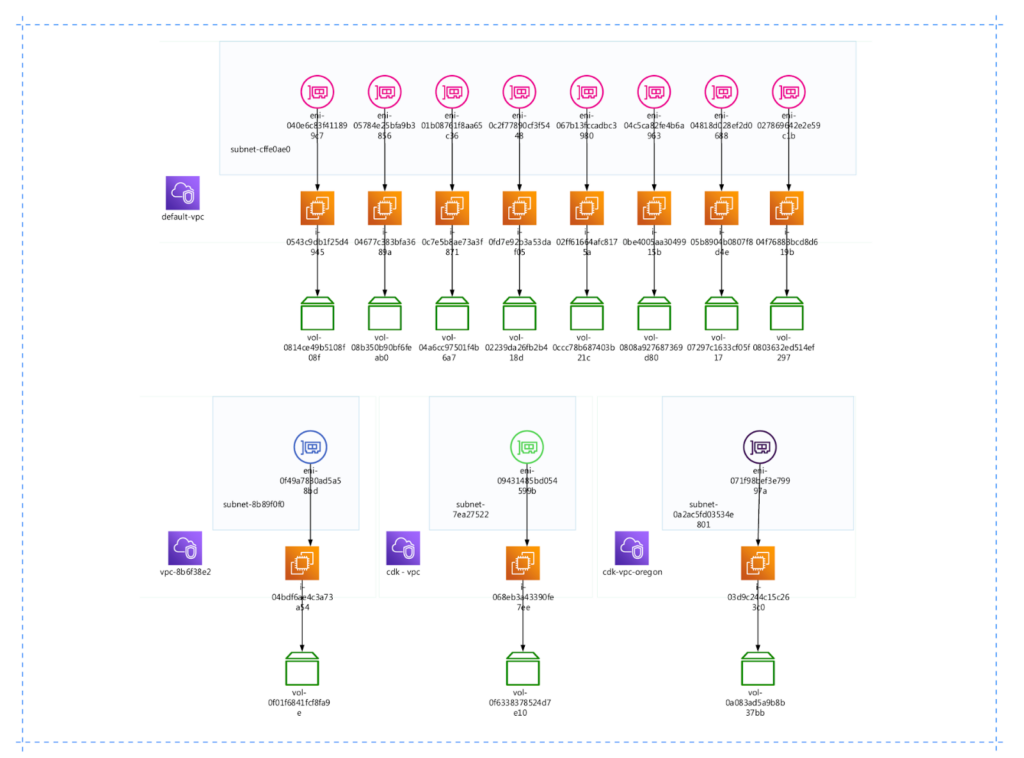
Holori excels at providing high-level visibility for complex cloud environments. Its primary strength is the automated generation of AWS diagrams directly from cloud accounts, eliminating the need for manual drawing. These diagrams sync daily, ensuring that they reflect the real-time state of your infrastructure.
The tool does not only display 2D and 3D diagrams,but it also provides detailed information about each resource’s configuration. Using Terraform structure, it lists all available settings for each resource bringing crystal clear vision into your asset’s configuration.
Since it generates diagrams daily, Holori can map side by side two iterations of your infra to help you spot differences. Its unique diff diagram merges two versions in a single diagram highlighting the resources that have been added, modified or deleted.
Beyond simple mapping, Holori offers a centralized cost-management dashboard. By connecting your AWS account, you can see resource configurations alongside their associated costs and usage, helping teams identify over-provisioned or unused assets. Its flexible editor also allows for manual customization, featuring a vast library of multi-cloud icons (AWS, Azure, GCP, and more) for hybrid designs.
2. Draw.io
Draw.io (also known by its domain diagrams.net) remains a key tool for manual AWS diagramming. Its core strength is complete flexibility with no licensing cost, a large library of shapes (including AWS icons). The tool supports a wide array of export formats (PNG, SVG, PDF, and XML) and integrates seamlessly with storage providers like Google Drive, OneDrive, and GitHub. Its offline desktop version and browser-based flexibility make it an ideal choice for quick brainstorming or creating polished diagrams for technical documentation without the overhead of automated enterprise tools.
Although it doesn’t provide account sync or automation, Draw.io’s drag-and-drop canvas and layering system make it a solid choice for simple architecture sketches or embedded diagrams in documentation. However, don’t expect it to automatically refresh alongside your life infra. The tool remains purely manual.
Draw.io is often used as a first diagramming tool by engineering students or within organizations before they switch to more professional alternatives.
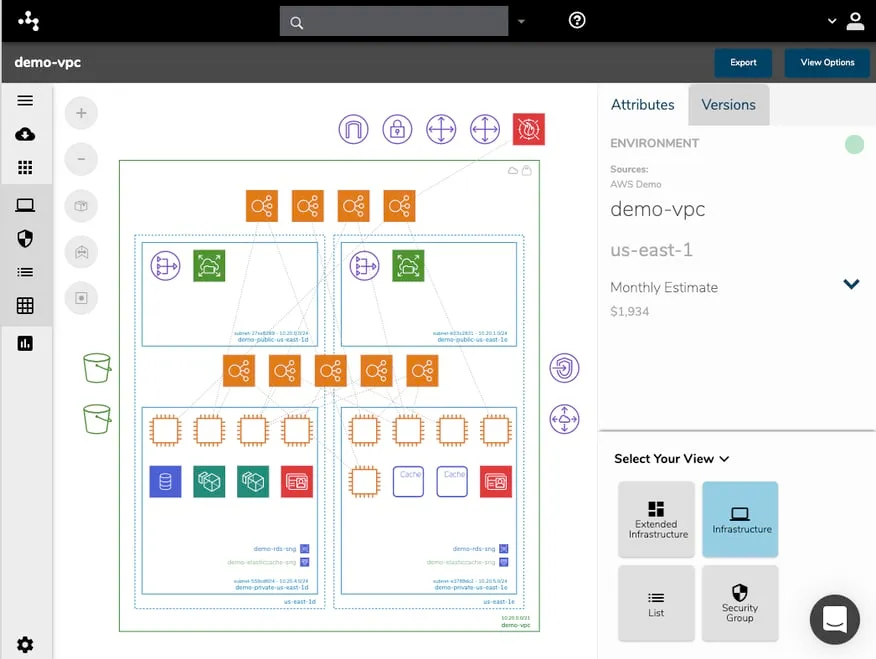
3. Cloudcraft (by Datadog)
Cloudcraft remains one of the most advanced platforms for visualizing AWS infrastructure with minimal manual work. Its live scanning feature automatically maps your entire multi-region cloud architecture, updates diagrams in real time, and supports filtering by region, VPC, or security groups.
The tool’s most significant feature is its integrated cost calculator. As you add or modify components like EC2 instances or RDS databases, Cloudcraft provides live pricing estimates. This makes it a useful tool for cost estimation and architectural planning, ensuring that performance requirements are balanced with budget constraints before any changes are pushed to production.
It also enables collaboration with live access to the same environment by multiple team members.
Cloudcraft is now integrated in Datadog’s product suite following its acquisition by the observability leader. The tool is valuable for DevOps teams, solutions architects, or FinOps practitioners who want diagrams that reflect real cloud state without manual refreshing.
4. Eraser
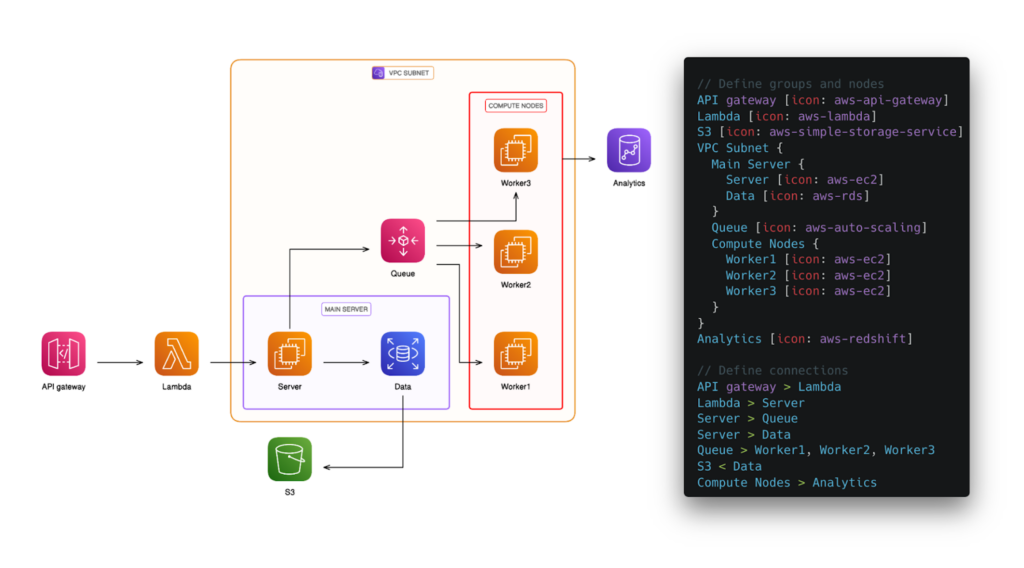
Eraser is a collaborative whiteboard-style tool built specifically for engineering teams. It bridges the gap between ideation and documentation by offering a “Diagram-as-Code” (DaC) approach. One of its key features is the ability to generate diagrams from Terraform code, allowing architects to visualize their Infrastructure as Code (IaC) before it is even deployed.
Eraser’s interface is split between a markdown-based note editor and a canvas, thus making it easy to document the “why” behind an architecture alongside the “how.” It also features AI-assisted diagramming, where you can describe a project in plain text to generate a starting layout, which can then be refined through real-time team collaboration.
While still emerging relative to established platforms, Eraser is great in ideation phases or when translating architectural ideas into structured visuals quickly. It’s particularly useful for brainstorming sessions, early planning, and documentation when the code or infrastructure is still evolving.
5. Miro
Miro is a versatile visual collaboration platform that serves as a digital “meeting room” for cloud teams. While it is a general-purpose whiteboard, its AWS shape libraries and integrations allow teams to plan and map out cloud migrations or new service deployments in a highly interactive environment. It includes intelligent templates, and AI features that can cluster content or suggest layouts, making it a strong choice for teams that work interactively on designs.
Miro’s strength lies in its vast integration ecosystem (Google Drive, Slack, Jira), allowing architecture diagrams to sit alongside project timelines and user stories. It supports some automated diagramming features, but its primary value is as a shared space where cross-functional teams (developers, product owners, and stakeholders) can iterate on designs together in real-time.
If your priority is interactive design workshops or stakeholder workshops, Miro remains compelling.
6. Microsoft Visio
Microsoft Visio is a long-standing veteran in the diagramming world, favored by large enterprises for its deep integration with Microsoft 365. While it requires manual effort to build diagrams, it offers an extensive range of AWS products and templates that allow for highly detailed, production-grade architectural documentation.
Visio is ideal for organizations that require standardized, professional diagrams that can be easily shared via Teams or SharePoint. It supports layering and data-linking, allowing users to connect diagram shapes to external data sources. For teams that already utilize the Microsoft ecosystem, it provides a familiar and robust environment for documenting complex AWS and hybrid-cloud infrastructures.
While lacking AWS auto-generation, its broad template library, familiar interface, and deep integration with Microsoft 365 make it a practical choice for cross-team diagramming.
7. Cloudockit
Cloudockit is a powerful automation tool that focuses heavily on comprehensive cloud documentation. It doesn’t just generate a diagram; it creates detailed technical reports in Word, PDF, or HTML that describe every asset in your AWS environment, including metadata and configurations.
It is particularly useful for compliance and governance. Moreover, Cloudockit can be scheduled to run automatically, ensuring that your documentation is never out of date. It supports multi-cloud environments and offers a “Desktop” version for teams with strict security requirements who prefer to generate documentation locally rather than through a SaaS platform.
While offering great documentation, the tool can lack flexibility and teams willing to “play” a bit more around their infra might be limited.
8. Luciscale & Lucidchart
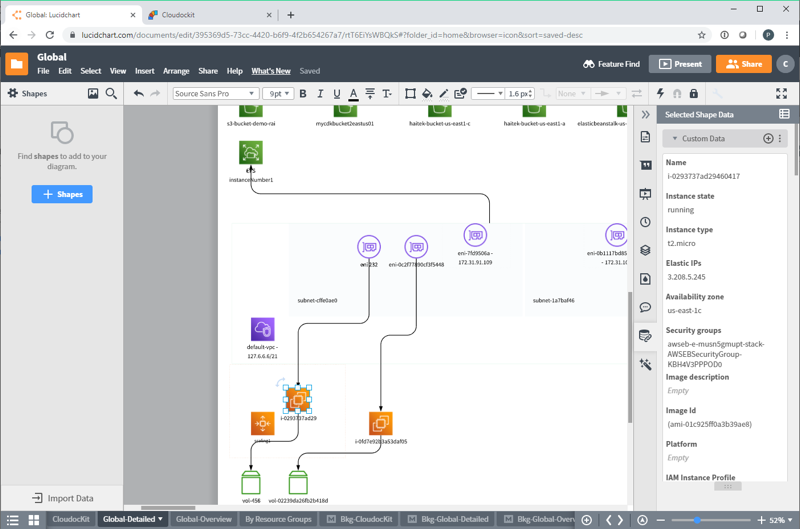
Lucidscale and Lucidchart work together to cover both ends of the diagramming spectrum. Lucidscale focuses on the automated side, scanning your AWS environment to visualize system dependencies, VPC hierarchies, and security configurations. It’s built for large-scale discovery and verifying that deployments match the intended design.
Once a diagram is generated in Lucidscale, it can be exported to Lucidchart for manual editing and enhancement. Lucidchart is an industry-standard diagramming platform with deep integration into tools like Jira and Confluence, making it easy to embed cloud architectures into broader business workflows and project documentation.
Lucidscale and Lucidchart strength is in enterprise usage, where accurate infrastructure insights, compliance documentation, and governance matter as much as diagram aesthetics.
9. Hava
Hava.io focuses on continuous cloud environment mapping, producing interactive AWS architecture diagrams that are audit-ready. It automatically pulls AWS configuration data and creates visualizations that reflect the current infrastructure state.
Unlike many diagramming tools, Hava also supports export to formats like Visio (VSDX), JSON, and CSV, making it easy to bring generated diagrams into other tools or workflows. This capability is especially helpful for analysts and architects who need to audit or further manipulate diagram data. Also, Hava’s API functionality further enables integration into DevOps pipelines or reporting workflows.
In addition, Hava includes a Security View, which visualizes security groups and traffic flows to help identify open ports or potential vulnerabilities. This is particularly useful for teams that prioritize accuracy and compliance over manual design.
10. Excalidraw
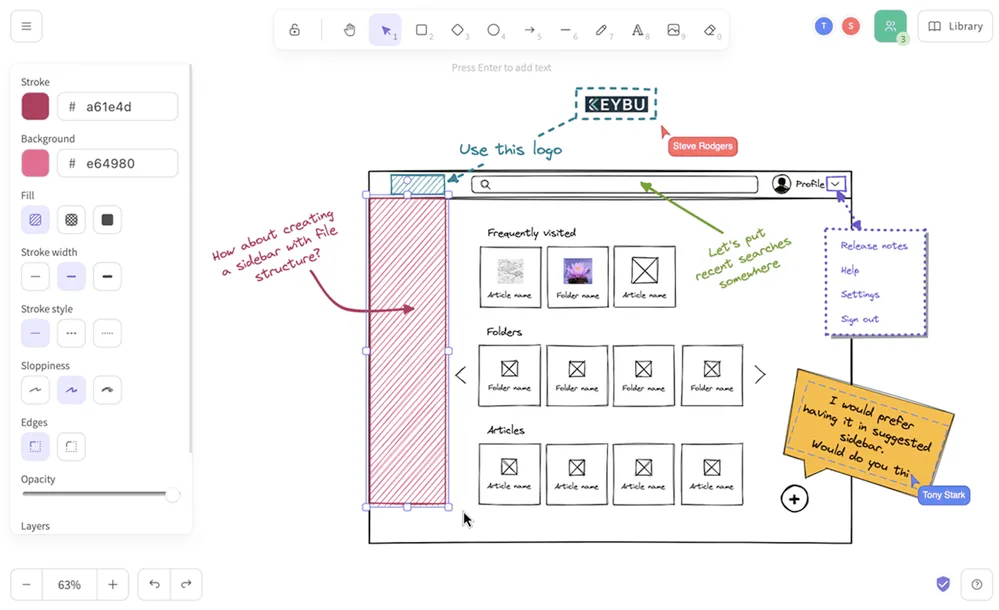
Excalidraw offers open-source, hand-drawn diagramming that focuses on simplicity and speed. Unlike high-fidelity enterprise tools, it is designed for rapid sketching and brainstorming. It is a virtual whiteboard that supports AWS icon libraries, making it perfect for early-stage architecture discussions where fluidity is more important than technical precision.
Because it is lightweight and browser-based, it is a favorite for live remote collaboration. Teams can hop on a canvas and sketch out data flows or high-level service layouts in seconds.
Despite its simplicity, Excalidraw offers several features that make it more powerful than a basic sketching tool. It supports basic shapes, text annotations, and lines to build AWS diagrams, and users can customize their designs to suit their needs. While the tool is not designed for detailed or production-level infrastructure diagrams, it is an excellent option for rapidly iterating on ideas, collaborating in real time, or visualizing abstract AWS concepts without getting bogged down in technical specifics.
Conclusion: what is the best AWS diagraming tool
Selecting the right AWS diagram tool depends on your needs, whether you prioritize auto-generation from existing infrastructure, from terraform or from scratch.
In 2026, the real challenge is no longer drawing AWS diagrams, it’s automation and accuracy. Static diagrams quickly fall out of sync with reality, while automated tools remain continuously aligned with your actual cloud infrastructure.
Holori AWS diagram tool stands out as the top choice. Thanks to it’s ability to synchronize diagrams automatically, display them in 2D or 3D, provide detailed information about each asset’s configuration and generate documentation automatically. Its intuitive interface makes it an ideal choice in 2026.
Whichever tool you choose, having a clear visual representation of your AWS infrastructure is key to efficient cloud management!
Try Holori now for clear AWS infrastructure and cost visibility: https://app.holori.com/